- UK House price prediction – June 2026
Economic summary
News
The UK economy stayed on fragile footing through June. Inflation, as measured by the Consumer Prices Index, held at 2.8% in the 12 months to May, unchanged from April and its lowest since March 2025, though services inflation climbed to 3.7%, the gauge the Bank watches most closely. With a US–Iran ceasefire easing energy prices, the Bank of England held Bank Rate at 3.75% for a fourth consecutive meeting on 18 June, voting 7–2 as two members pressed for a rise to 4%. Momentum stayed weak, however, with monthly GDP down 0.1% in April and the composite PMI slipping into contraction in May for the first time in over a year.
ONS Revisions
Before we begin, a note on this month’s figures. The ONS has substantially revised its house-price series. Its latest release reports that UK prices rose 3.8% in the year to April 2026, the strongest annual rate since March 2025, up sharply from a revised estimate of 0.0% in the 12 months to March. Much of that jump is a base effect: prices fell 2.9% in April 2025 around the Stamp Duty changes, flattering this year’s annual comparison. Because our model is built on this revised ONS data, several of the growth figures below look markedly different from previous months, and month-to-month comparisons with earlier posts should be treated with caution.
Indicators
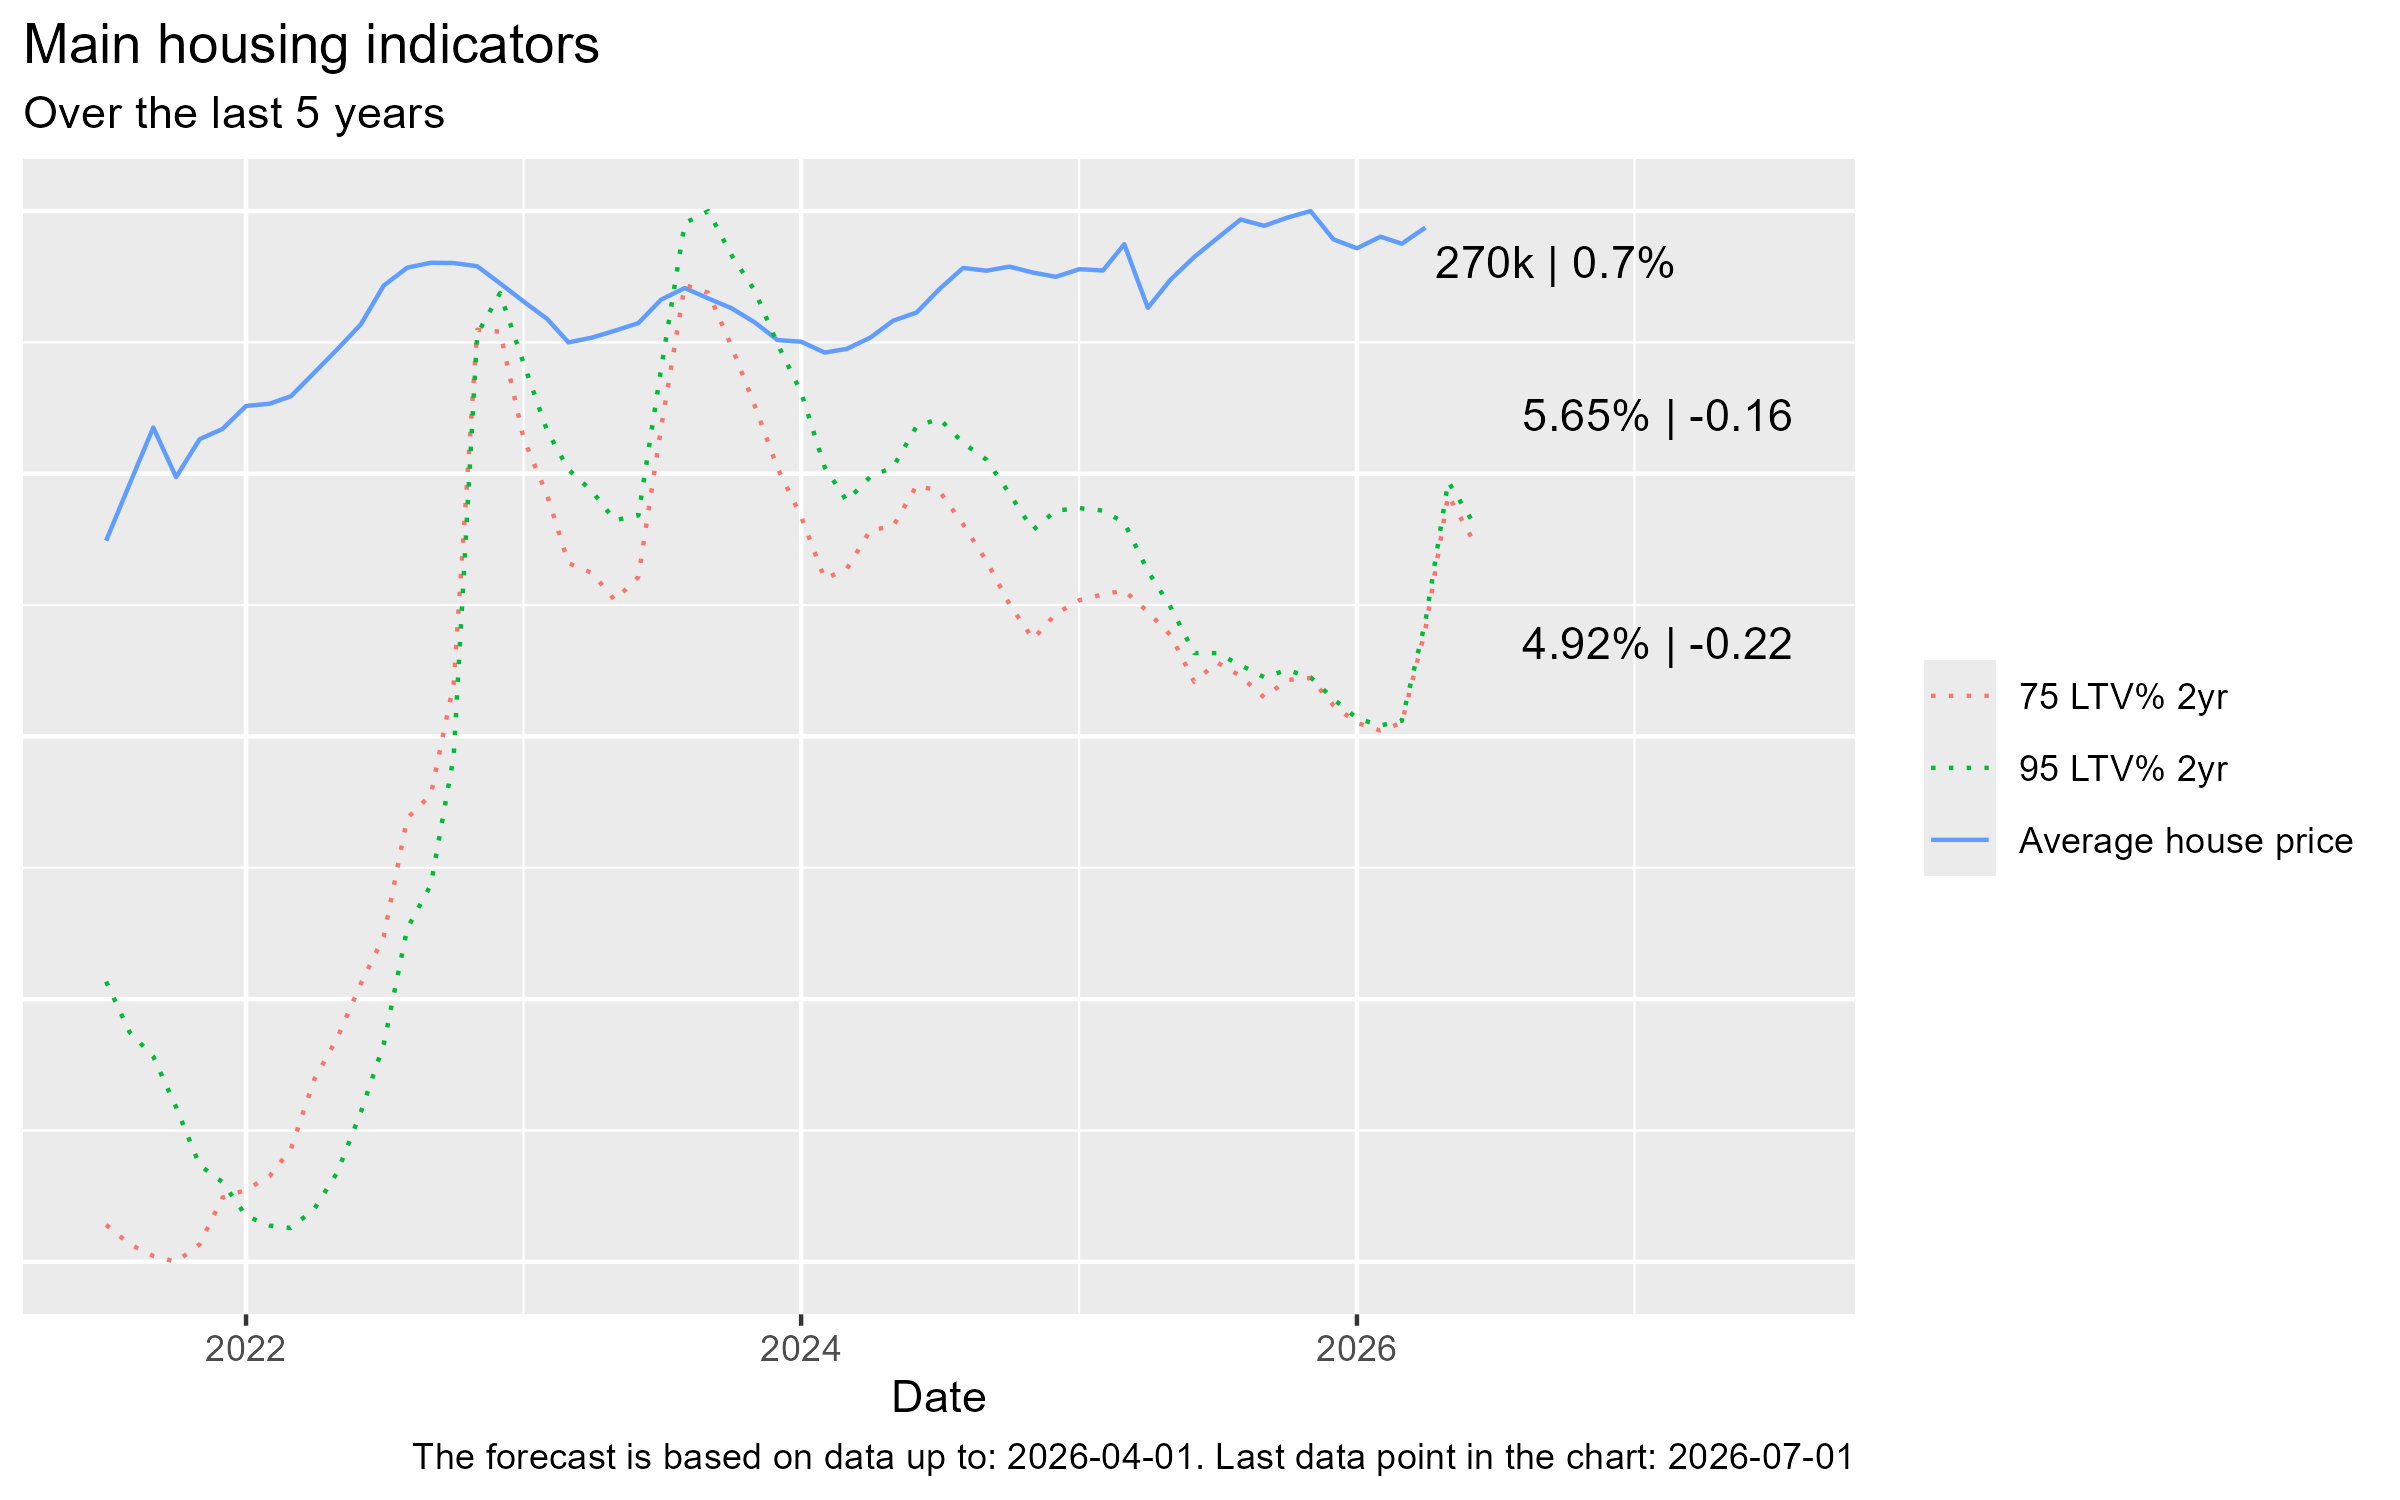
- Average house prices rose to £270k, up 0.7% on the previous month
- The average 75% LTV 2-year mortgage rate stood at 4.92% and the 95% LTV 2-year rate at 5.65% — both a touch lower at the latest reading (−0.22 and −0.16 respectively) but well above their spring lows after the energy-driven jump in gilt yields
Current growth rates
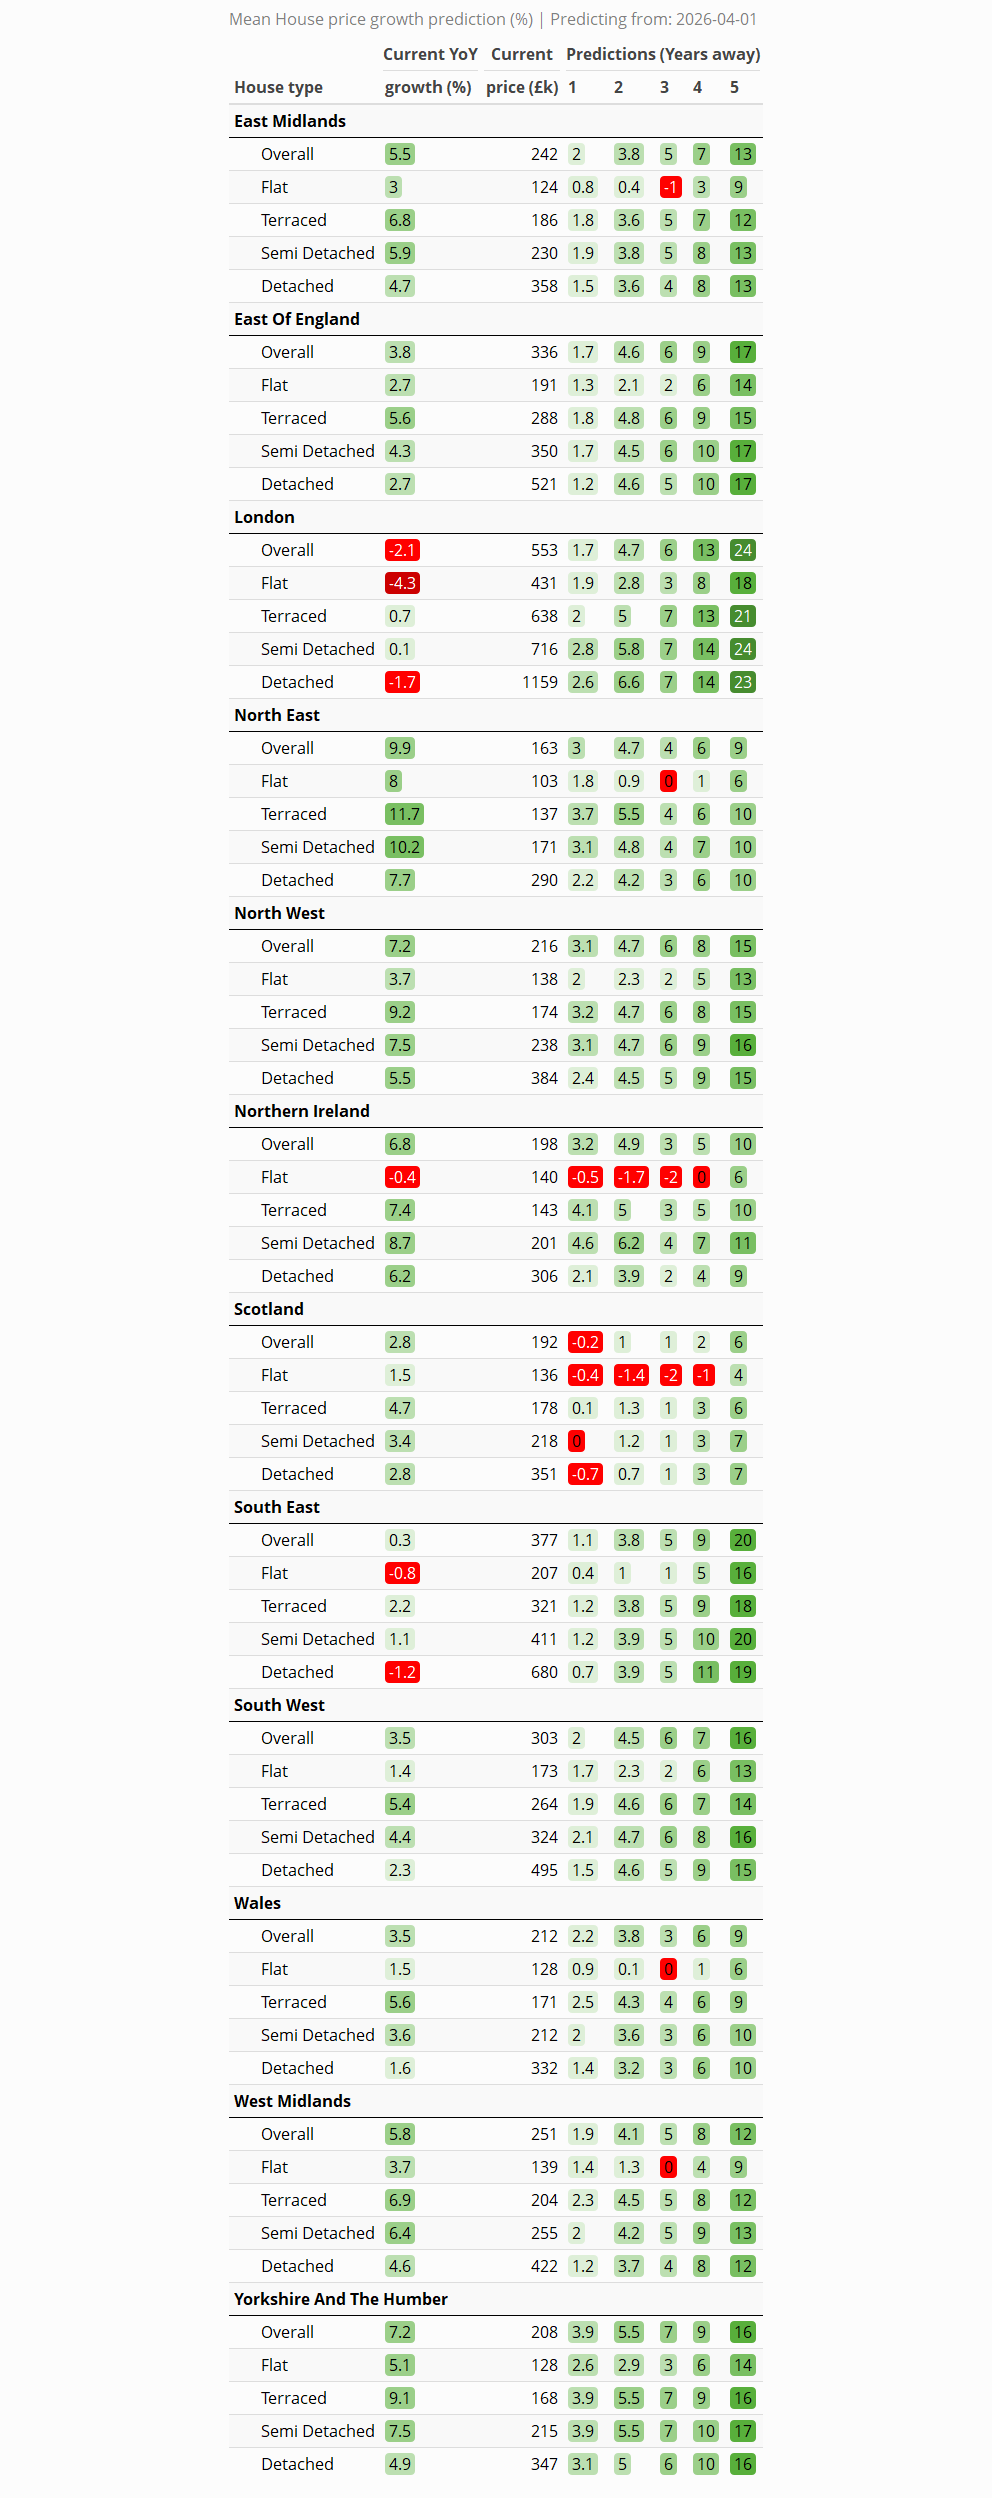
Across the regions, the revised data confirms a stark north–south split. The North East now leads the UK with annual growth of +9.9%, followed by the North West and Yorkshire and The Humber (both +7.2%) and Northern Ireland (+6.8%), with the West Midlands (+5.8%) and East Midlands (+5.5%) close behind. London remains the clear outlier, down −2.1% over the year, while the South East (+0.3%) is barely positive and Scotland (+2.8%), Wales (+3.5%) and the South West (+3.5%) sit in the middle of the pack. The familiar pattern holds: affordability pressure continues to bite hardest in the higher-priced southern markets.
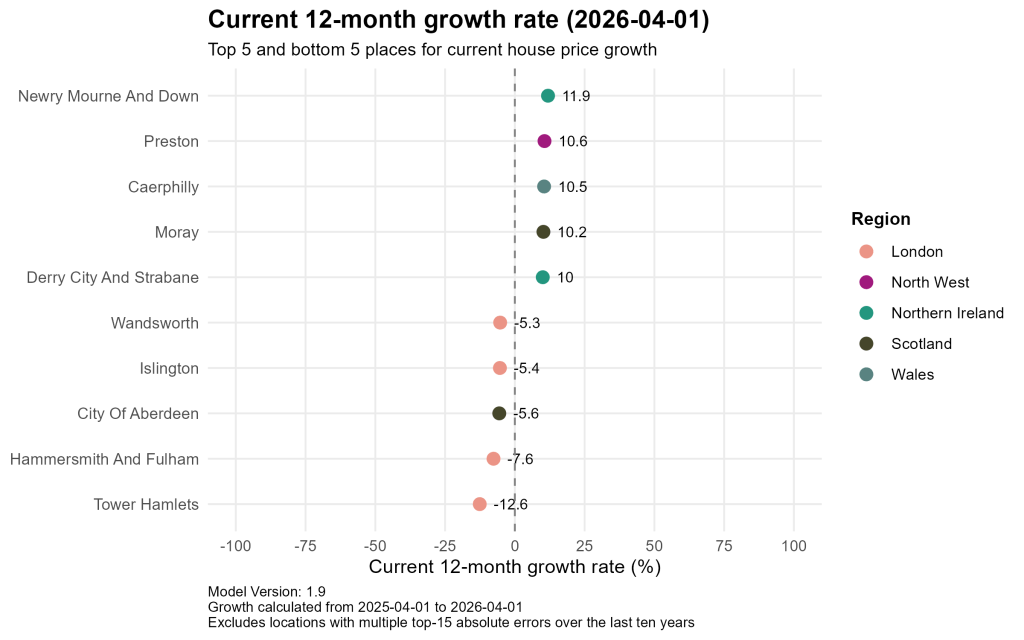
At the local level the divergence is even sharper. Newry Mourne and Down in Northern Ireland leads the country with 12-month growth of +11.9%, followed by Preston in the North West (+10.6%), Caerphilly in Wales (+10.5%), Moray in Scotland (+10.2%) and Derry City and Strabane in Northern Ireland (+10.0%) — a top five drawn entirely from more affordable northern, Welsh and Irish markets. London dominates the other end: Tower Hamlets has fallen −12.6% over the year, with Hammersmith and Fulham (−7.6%), Islington (−5.4%) and Wandsworth (−5.3%) also sharply down, joined by City of Aberdeen in Scotland (−5.6%). The scale of these swings underlines just how unevenly the market is moving.
Predictions
Overall
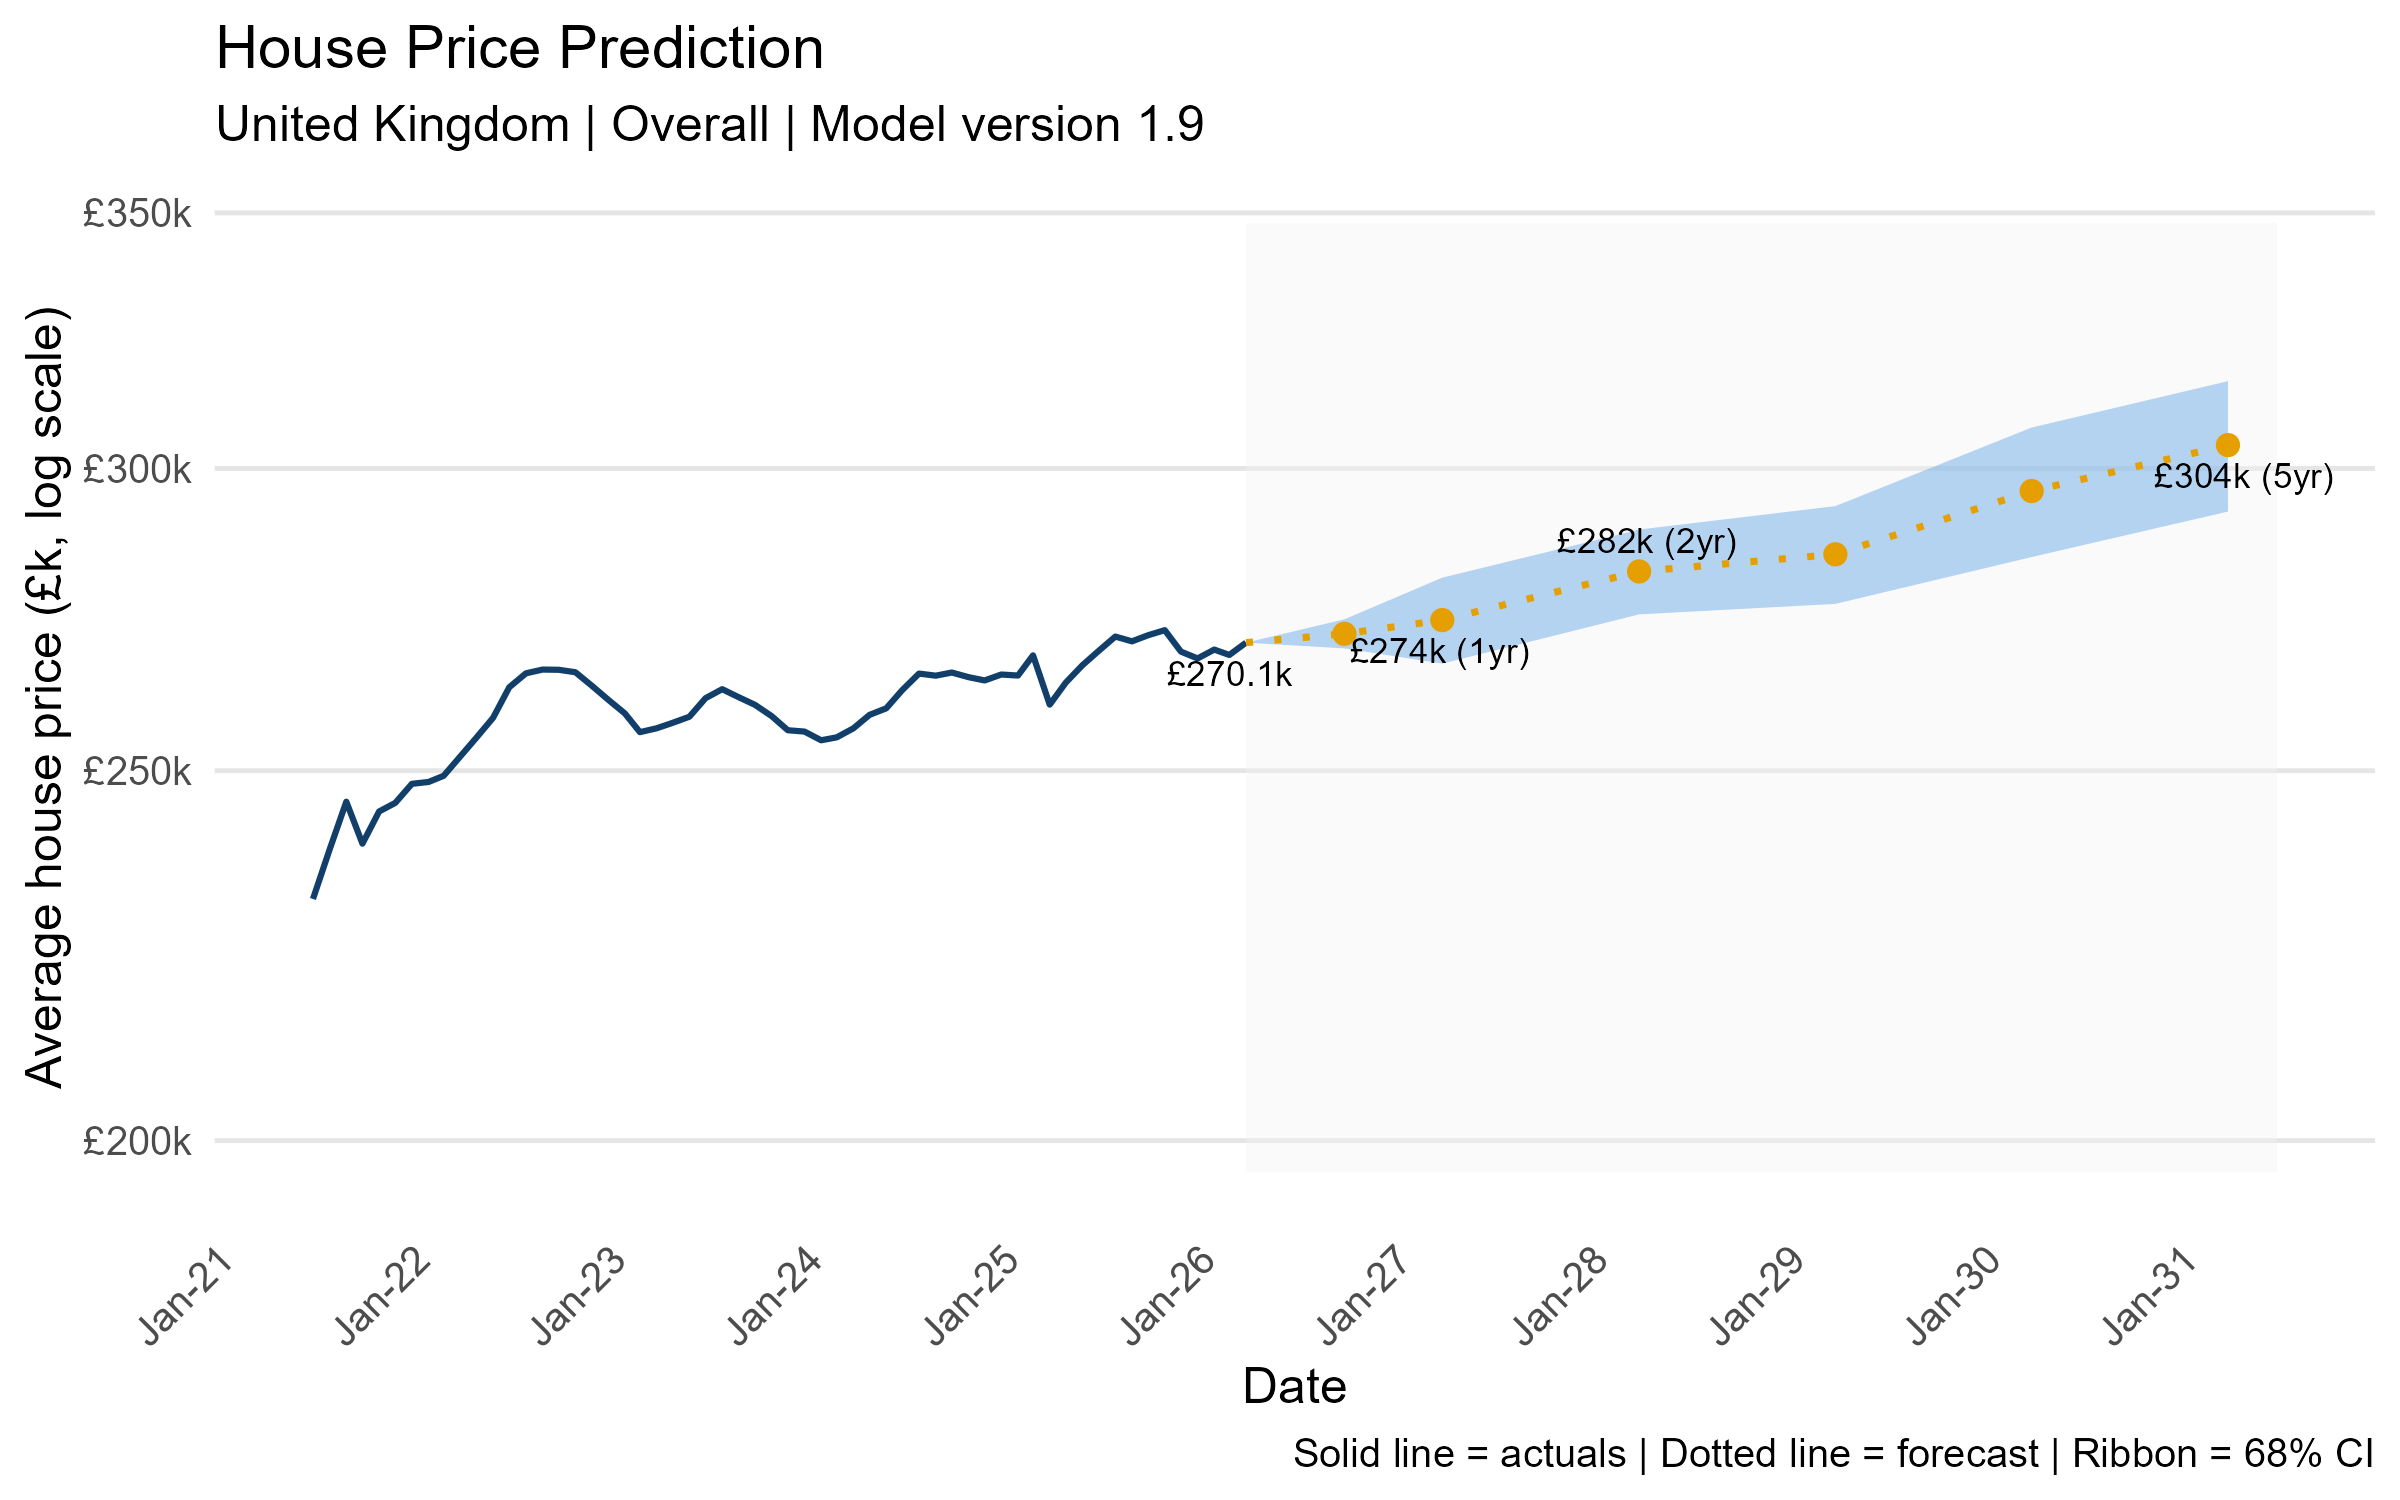
The model projects steady growth from the current £270.1k, rising to £274k within a year, £282k by 2028 and around £304k by 2031, cumulative growth of roughly 13% over five years. The widening confidence band beyond the two-year horizon reflects the genuine uncertainty in the energy and geopolitical outlook.
Regional
Short term (years 1–2): In year one, growth is positive across almost every region, led by Yorkshire and The Humber (+3.9%), Northern Ireland (+3.2%), the North West (+3.1%) and the North East (+3.0%), with Scotland the only region in negative territory at −0.2%. By year two the gains broaden to a cumulative +5% or so across Yorkshire (+5.5%), Northern Ireland (+4.9%) and London, the North West and the North East (all +4.7%), while Scotland continues to lag at +1%.
Medium term (years 3–4): Through years three and four London stages a marked turnaround, accelerating to +6% cumulative by year three and +13% by year four — comfortably the strongest four-year gain of any region. The East of England, Yorkshire and the South East (all around +9%) and the North West (+8%) follow, whereas Scotland (+2%) and the North East (+6%) bring up the rear.
Long term (year 5): Over the full five years the ranking inverts relative to recent editions: London tops the table at +24%, ahead of the South East (+20%), the East of England (+17%), Yorkshire and The Humber (+16%) and the South West (+16%). The affordable markets that led early on settle mid-table — the North West (+15%) and East Midlands (+13%) — while Scotland (+6%), the North East (+9%), Wales (+9%) and Northern Ireland (+10%) now trail the field.
Local
12-month prediction (to April 2027)
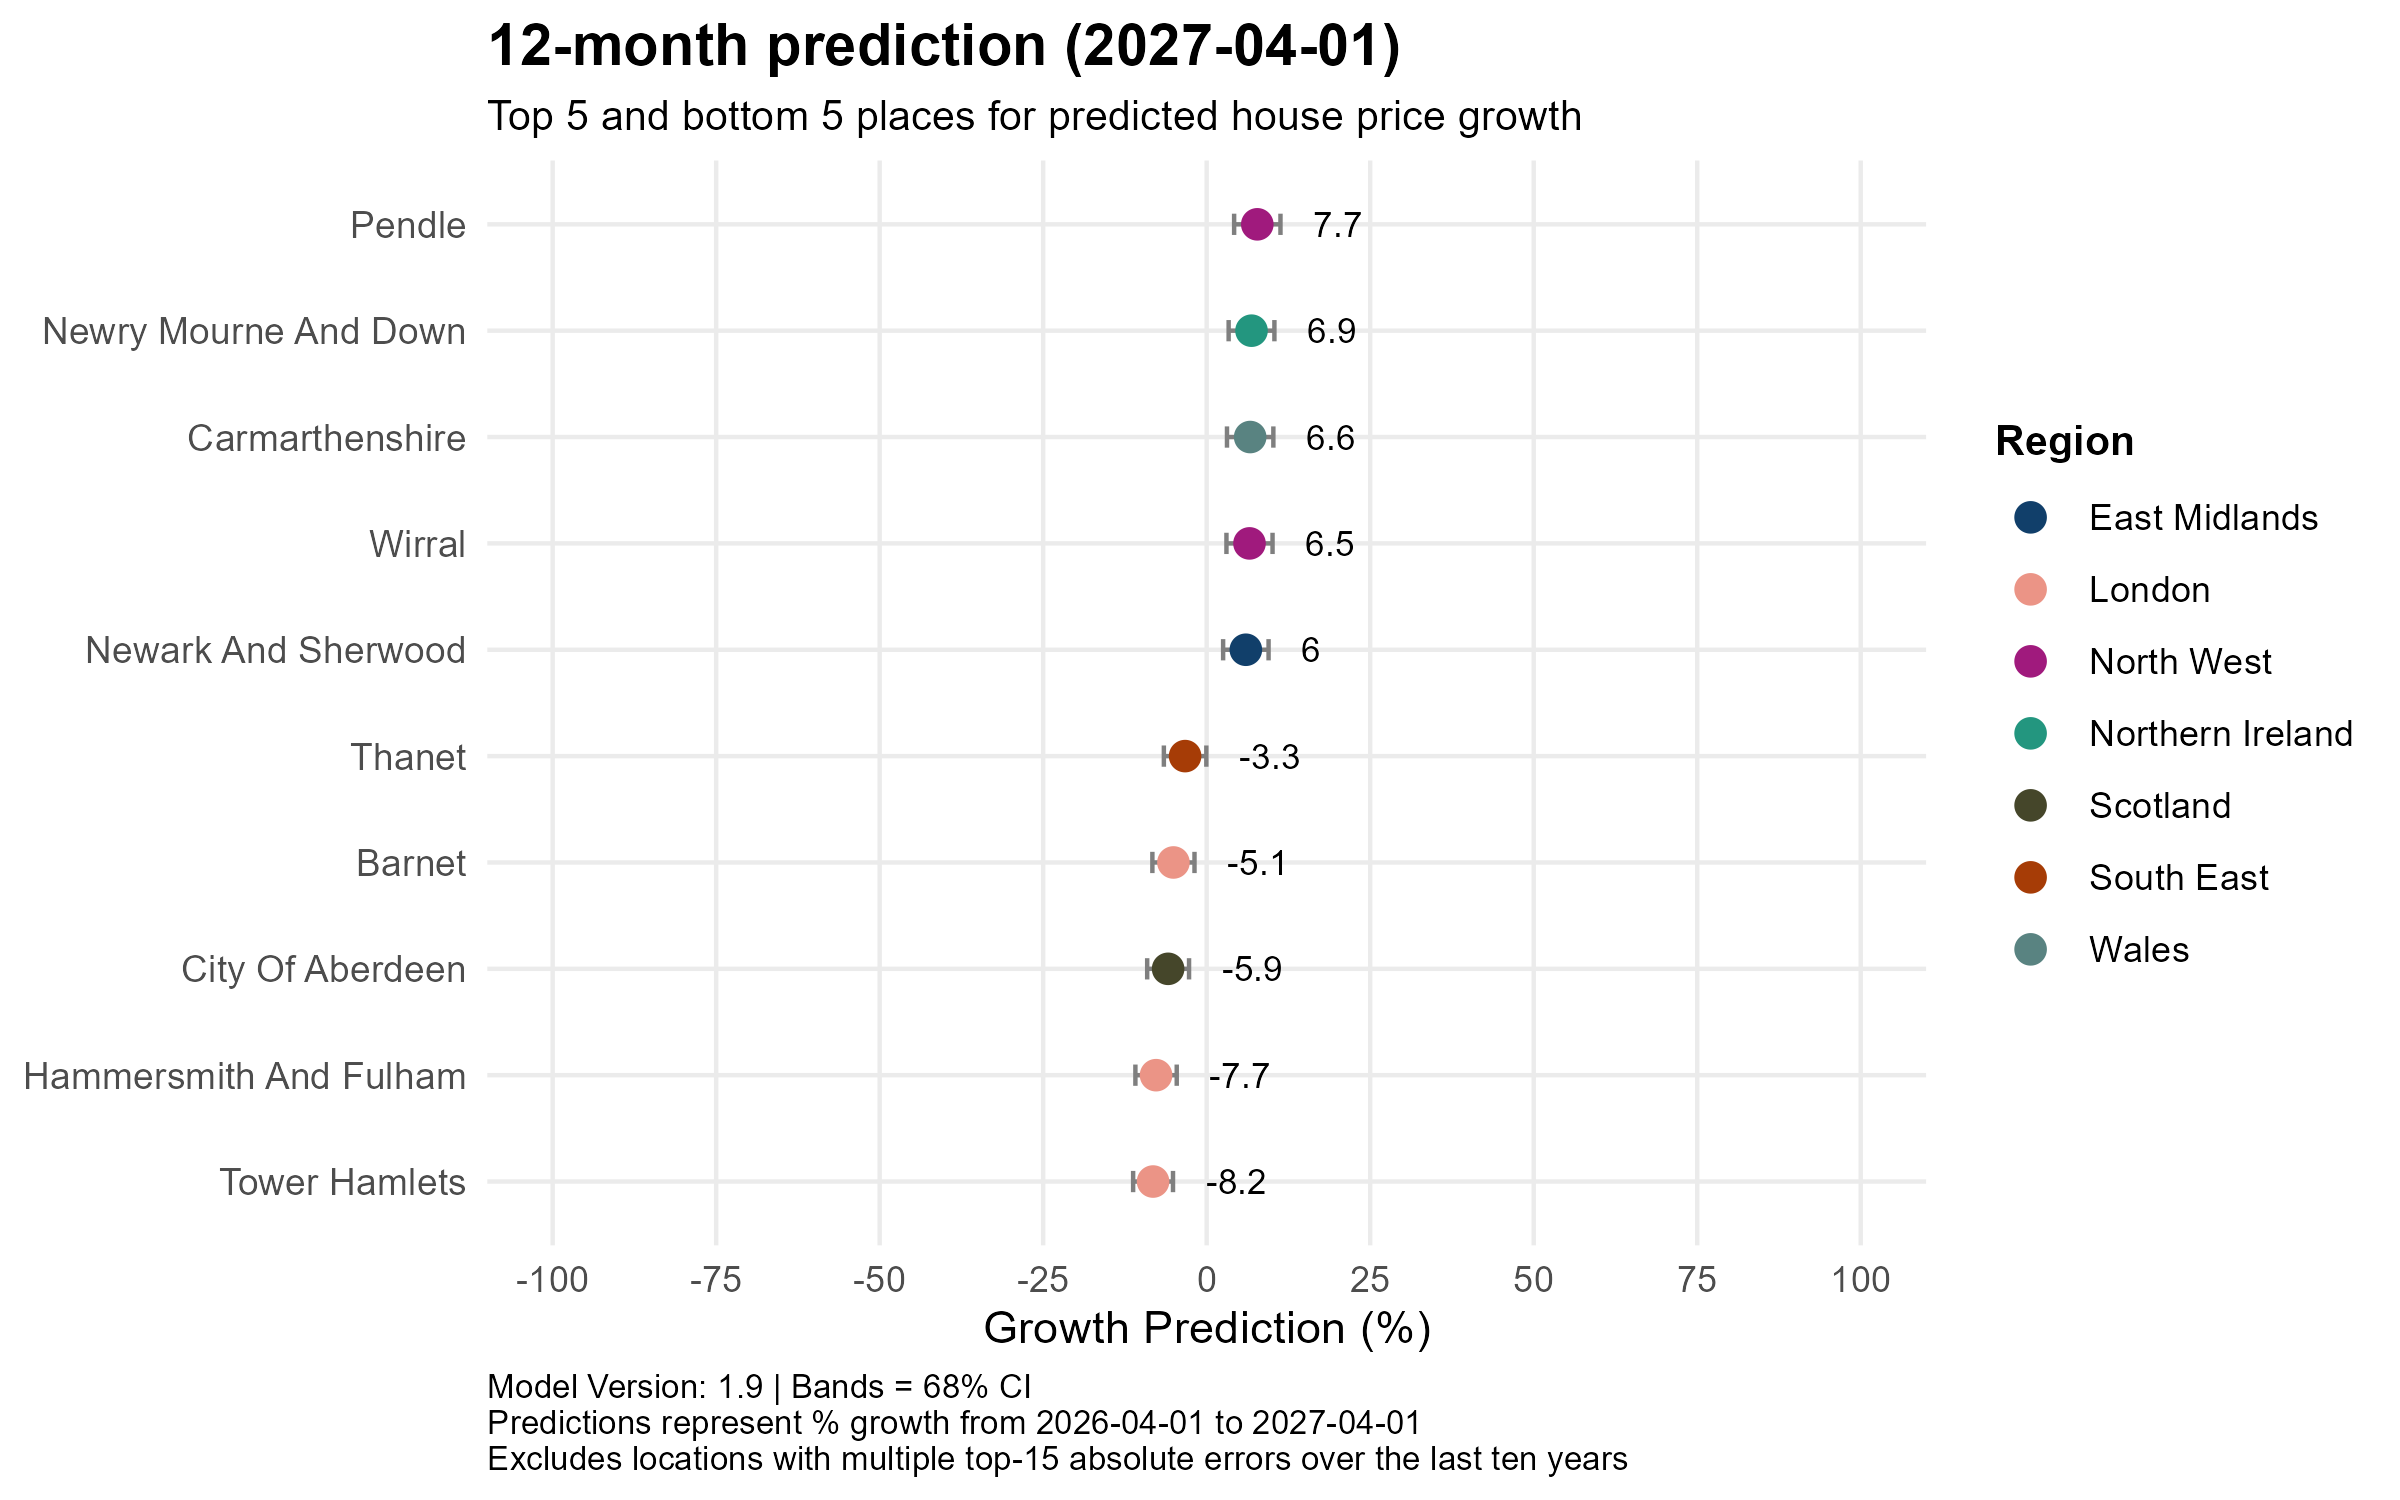
In the near term the affordable North and West still dominate the top of the table, with Pendle in the North West leading at +7.7%, followed by Newry Mourne and Down in Northern Ireland (+6.9%), Carmarthenshire in Wales (+6.6%), Wirral in the North West (+6.5%) and Newark and Sherwood in the East Midlands (+6.0%). The weakest forecasts remain concentrated in London, where Tower Hamlets (−8.2%), Hammersmith and Fulham (−7.7%) and Barnet (−5.1%) are all expected to fall, joined by City of Aberdeen in Scotland (−5.9%) and Thanet in Kent (−3.3%). The short-term story, then, is little changed: the correction is still biting hardest in the capital and in Aberdeen’s oil-exposed market.
24-month prediction (to April 2028)
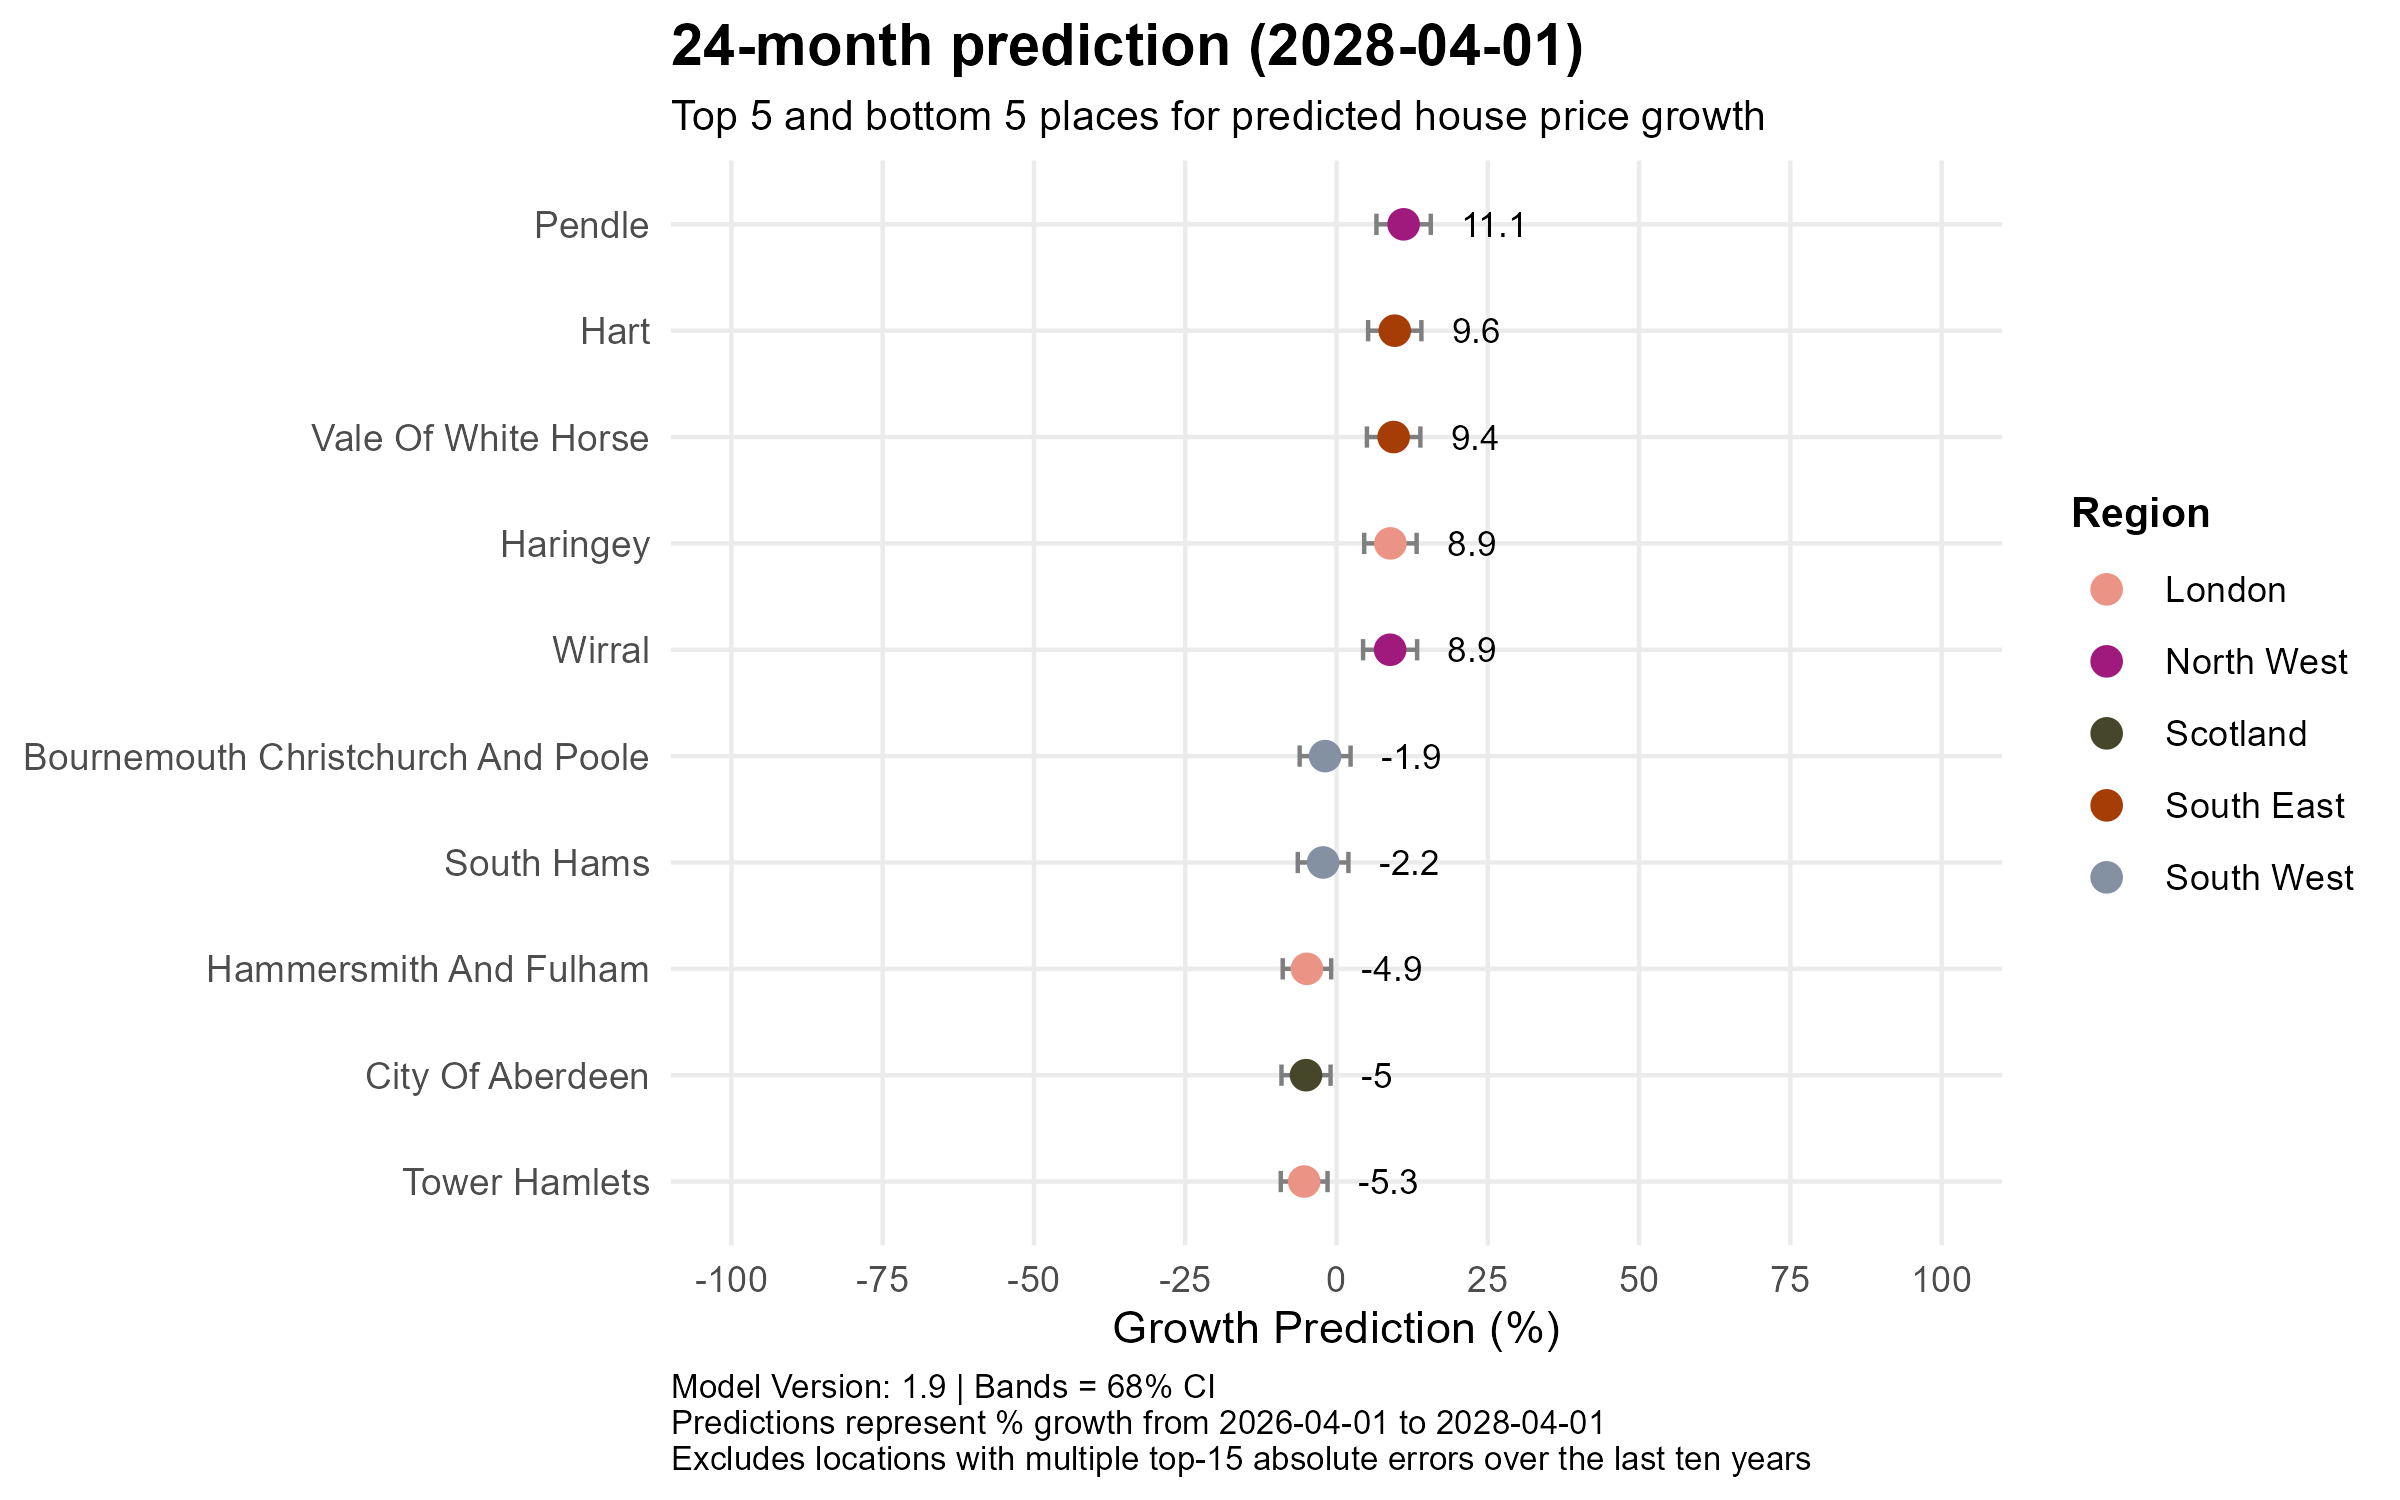
By the two-year horizon the composition begins to shift. Pendle (+11.1%) still leads, but two South East commuter areas — Hart (+9.6%) and Vale of White Horse (+9.4%) — climb into the top five alongside Wirral (+8.9%), and, tellingly, a London borough appears among the winners for the first time in months as Haringey reaches +8.9%. The laggards are softening too: Tower Hamlets (−5.3%), City of Aberdeen (−5.0%) and Hammersmith and Fulham (−4.9%) remain negative but their losses are shrinking, with two South West coastal markets — South Hams (−2.2%) and Bournemouth Christchurch and Poole (−1.9%) — completing the bottom five.
60-month prediction (to April 2031)
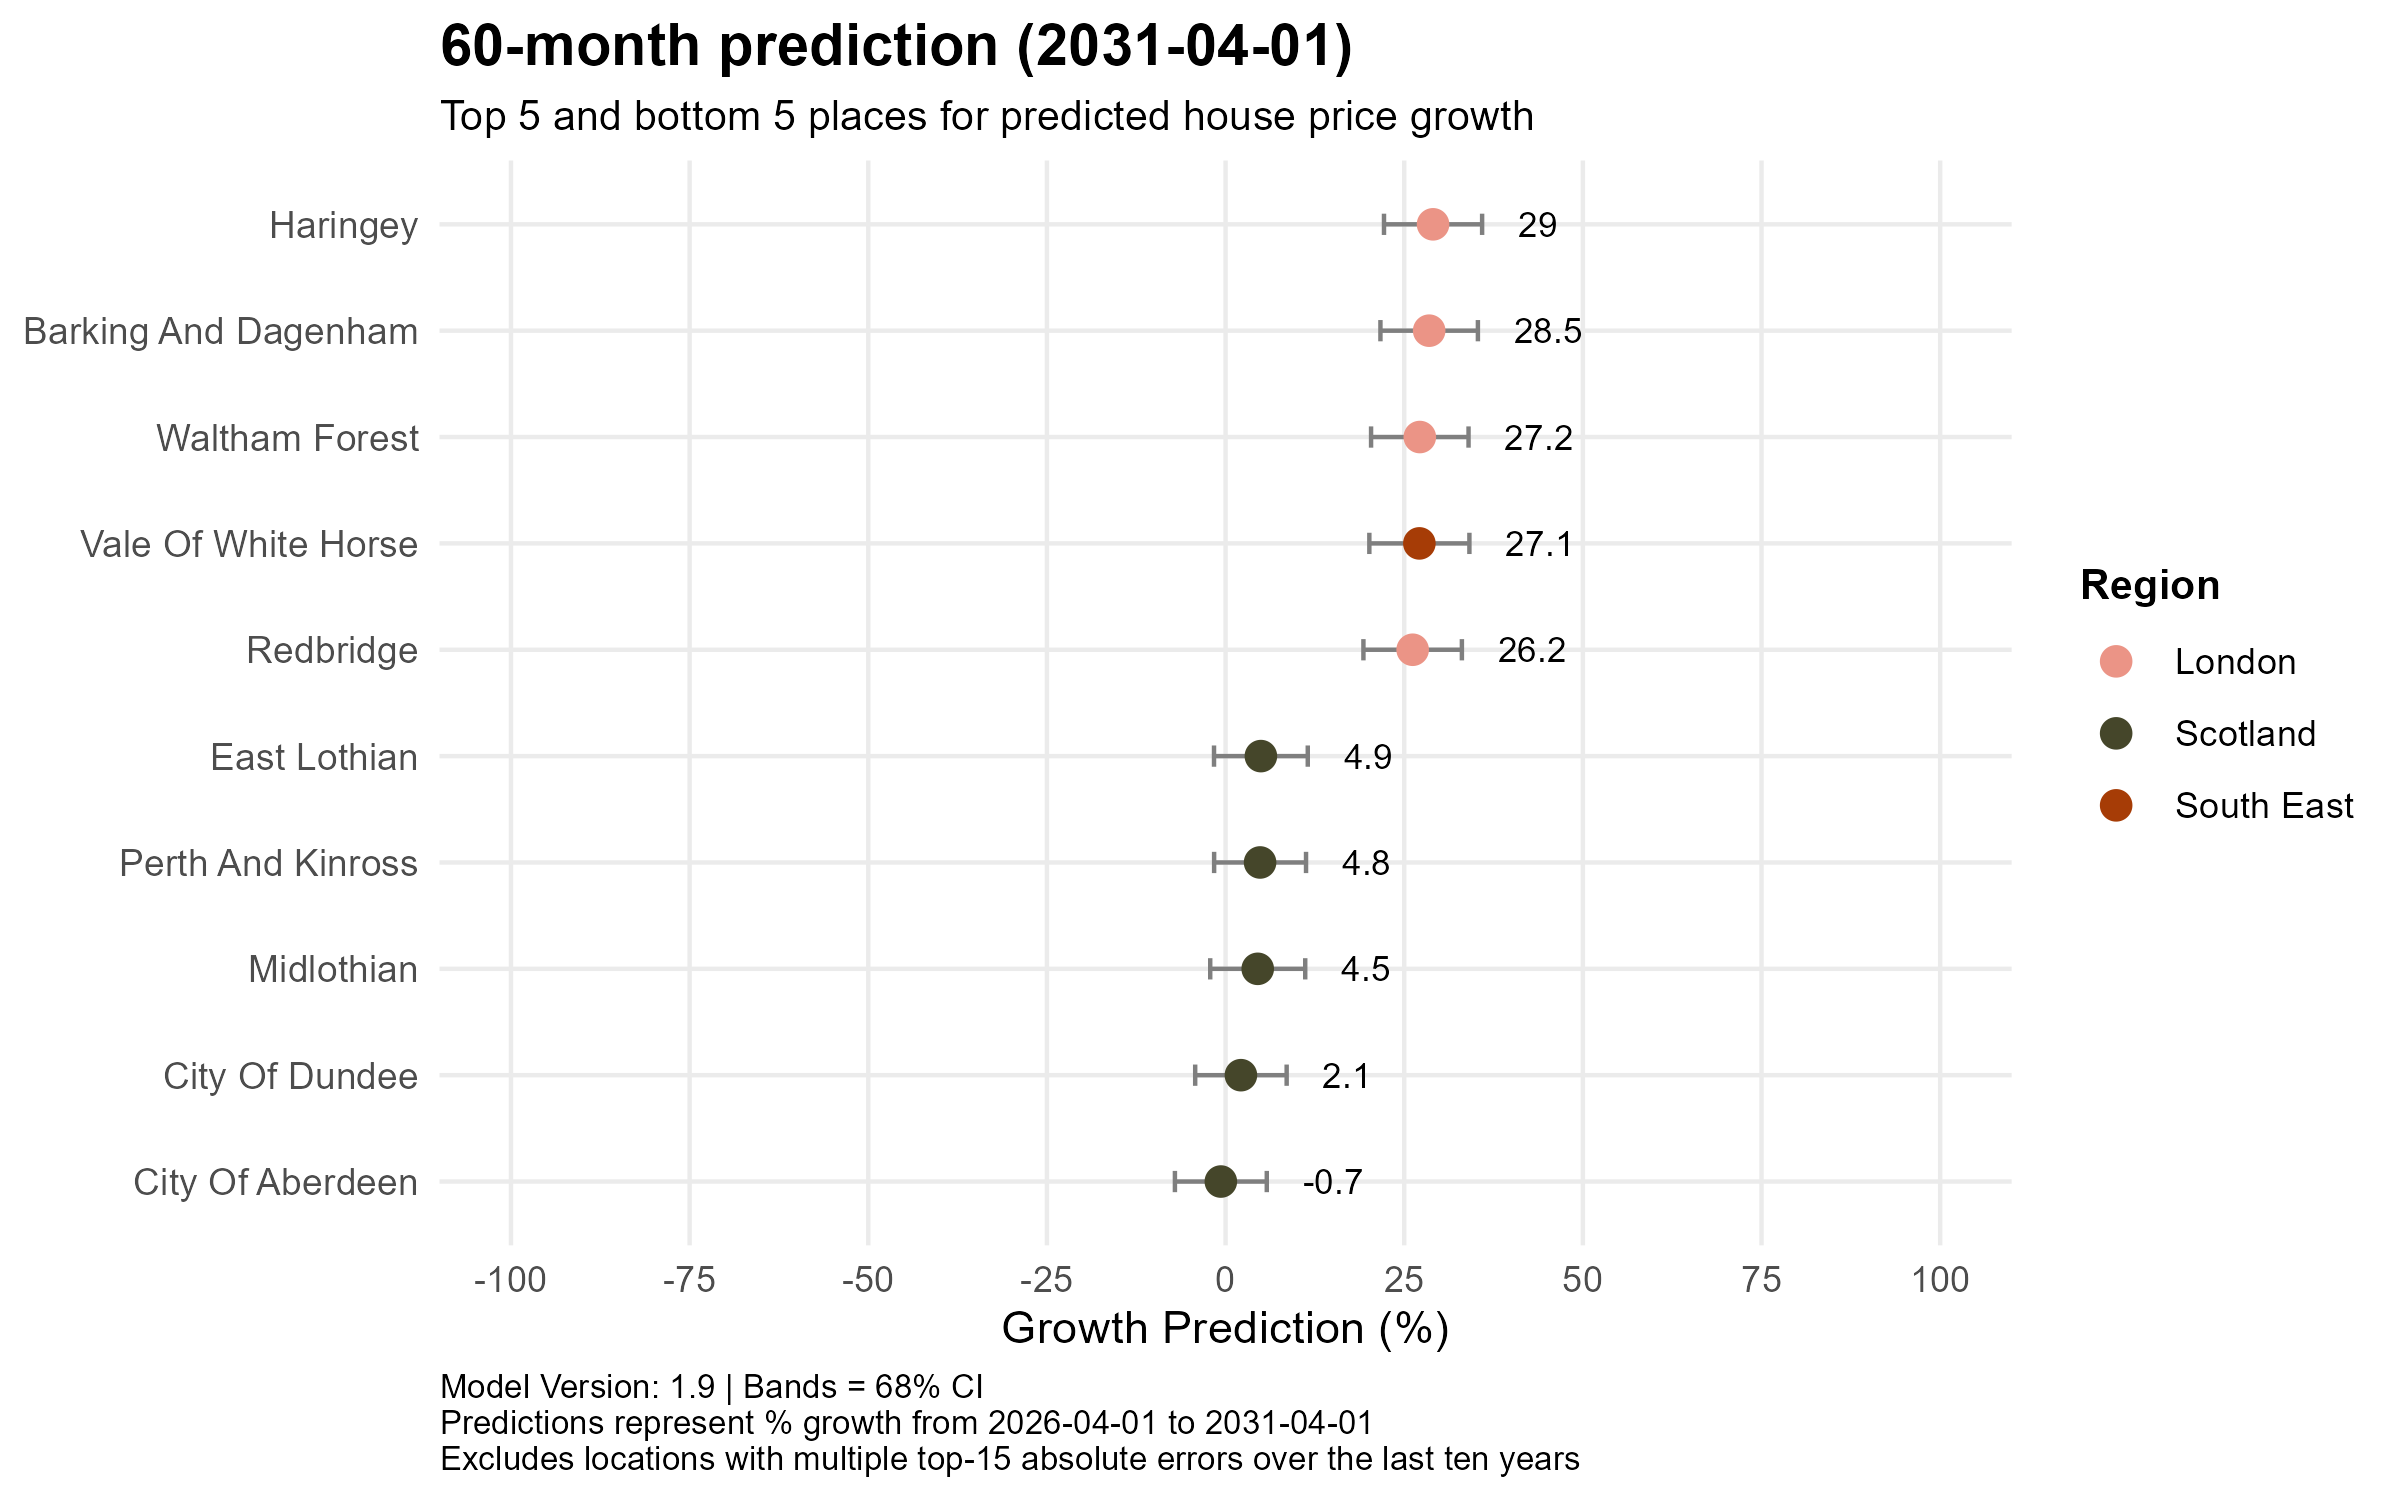
The five-year view completes the rebalancing and turns the recent narrative on its head. London boroughs now sweep the top of the leaderboard — Haringey (+29%), Barking and Dagenham (+28.5%), Waltham Forest (+27.2%) and Redbridge (+26.2%) — joined only by Vale of White Horse in Oxfordshire (+27.1%), as the capital’s earlier correction gives way to the strongest long-run gains in the country. At the other end, the bottom five are drawn entirely from Scotland, led by City of Aberdeen — the sole area still fractionally negative at −0.7% — alongside City of Dundee (+2.1%), Midlothian (+4.5%), Perth and Kinross (+4.8%) and East Lothian (+4.9%). The affordability that powered Northern Ireland and the North in the short term ultimately gives way to a London-led recovery, while Scotland’s structural weakness persists across the whole horizon.
Conclusion
The rebalancing theme that has run through recent editions is maturing into something more surprising. In the near term the affordable North, Northern Ireland and Wales still lead, and the correction continues to weigh on London and Aberdeen. But the ONS’s substantial upward revision, together with London’s much-improved affordability, has flipped the medium- and long-run picture: the capital and the wider South East now top the five-year rankings, while Scotland — especially its oil-exposed north-east — emerges as the persistent laggard. As last month’s post also noted, the direction of travel remains steady rather than dramatic. Nationally, the model still points to a gradual climb towards £304k by 2031 — no boom, but no crash either.
- UK House price prediction – May 2026
Economic summary
News
The UK economic backdrop remained under significant pressure in May. UK inflation eased to 2.8% in April, down from 3.3% in March, helped by lower household energy bills, though the Bank of England warned that continued disruption in the Strait of Hormuz could push inflation back towards 4% by year-end as oil and shipping costs rise. The S&P Global Flash UK PMI composite index fell to 48.5 in May, below the 50-point growth threshold for the first time in over a year, with services activity dropping to a 64-month low of 47.9. According to the ONS Business Insights and Conditions Survey, 34% of trading businesses reported economic uncertainty impacting turnover in early May, five percentage points higher than a year ago.
Indicators
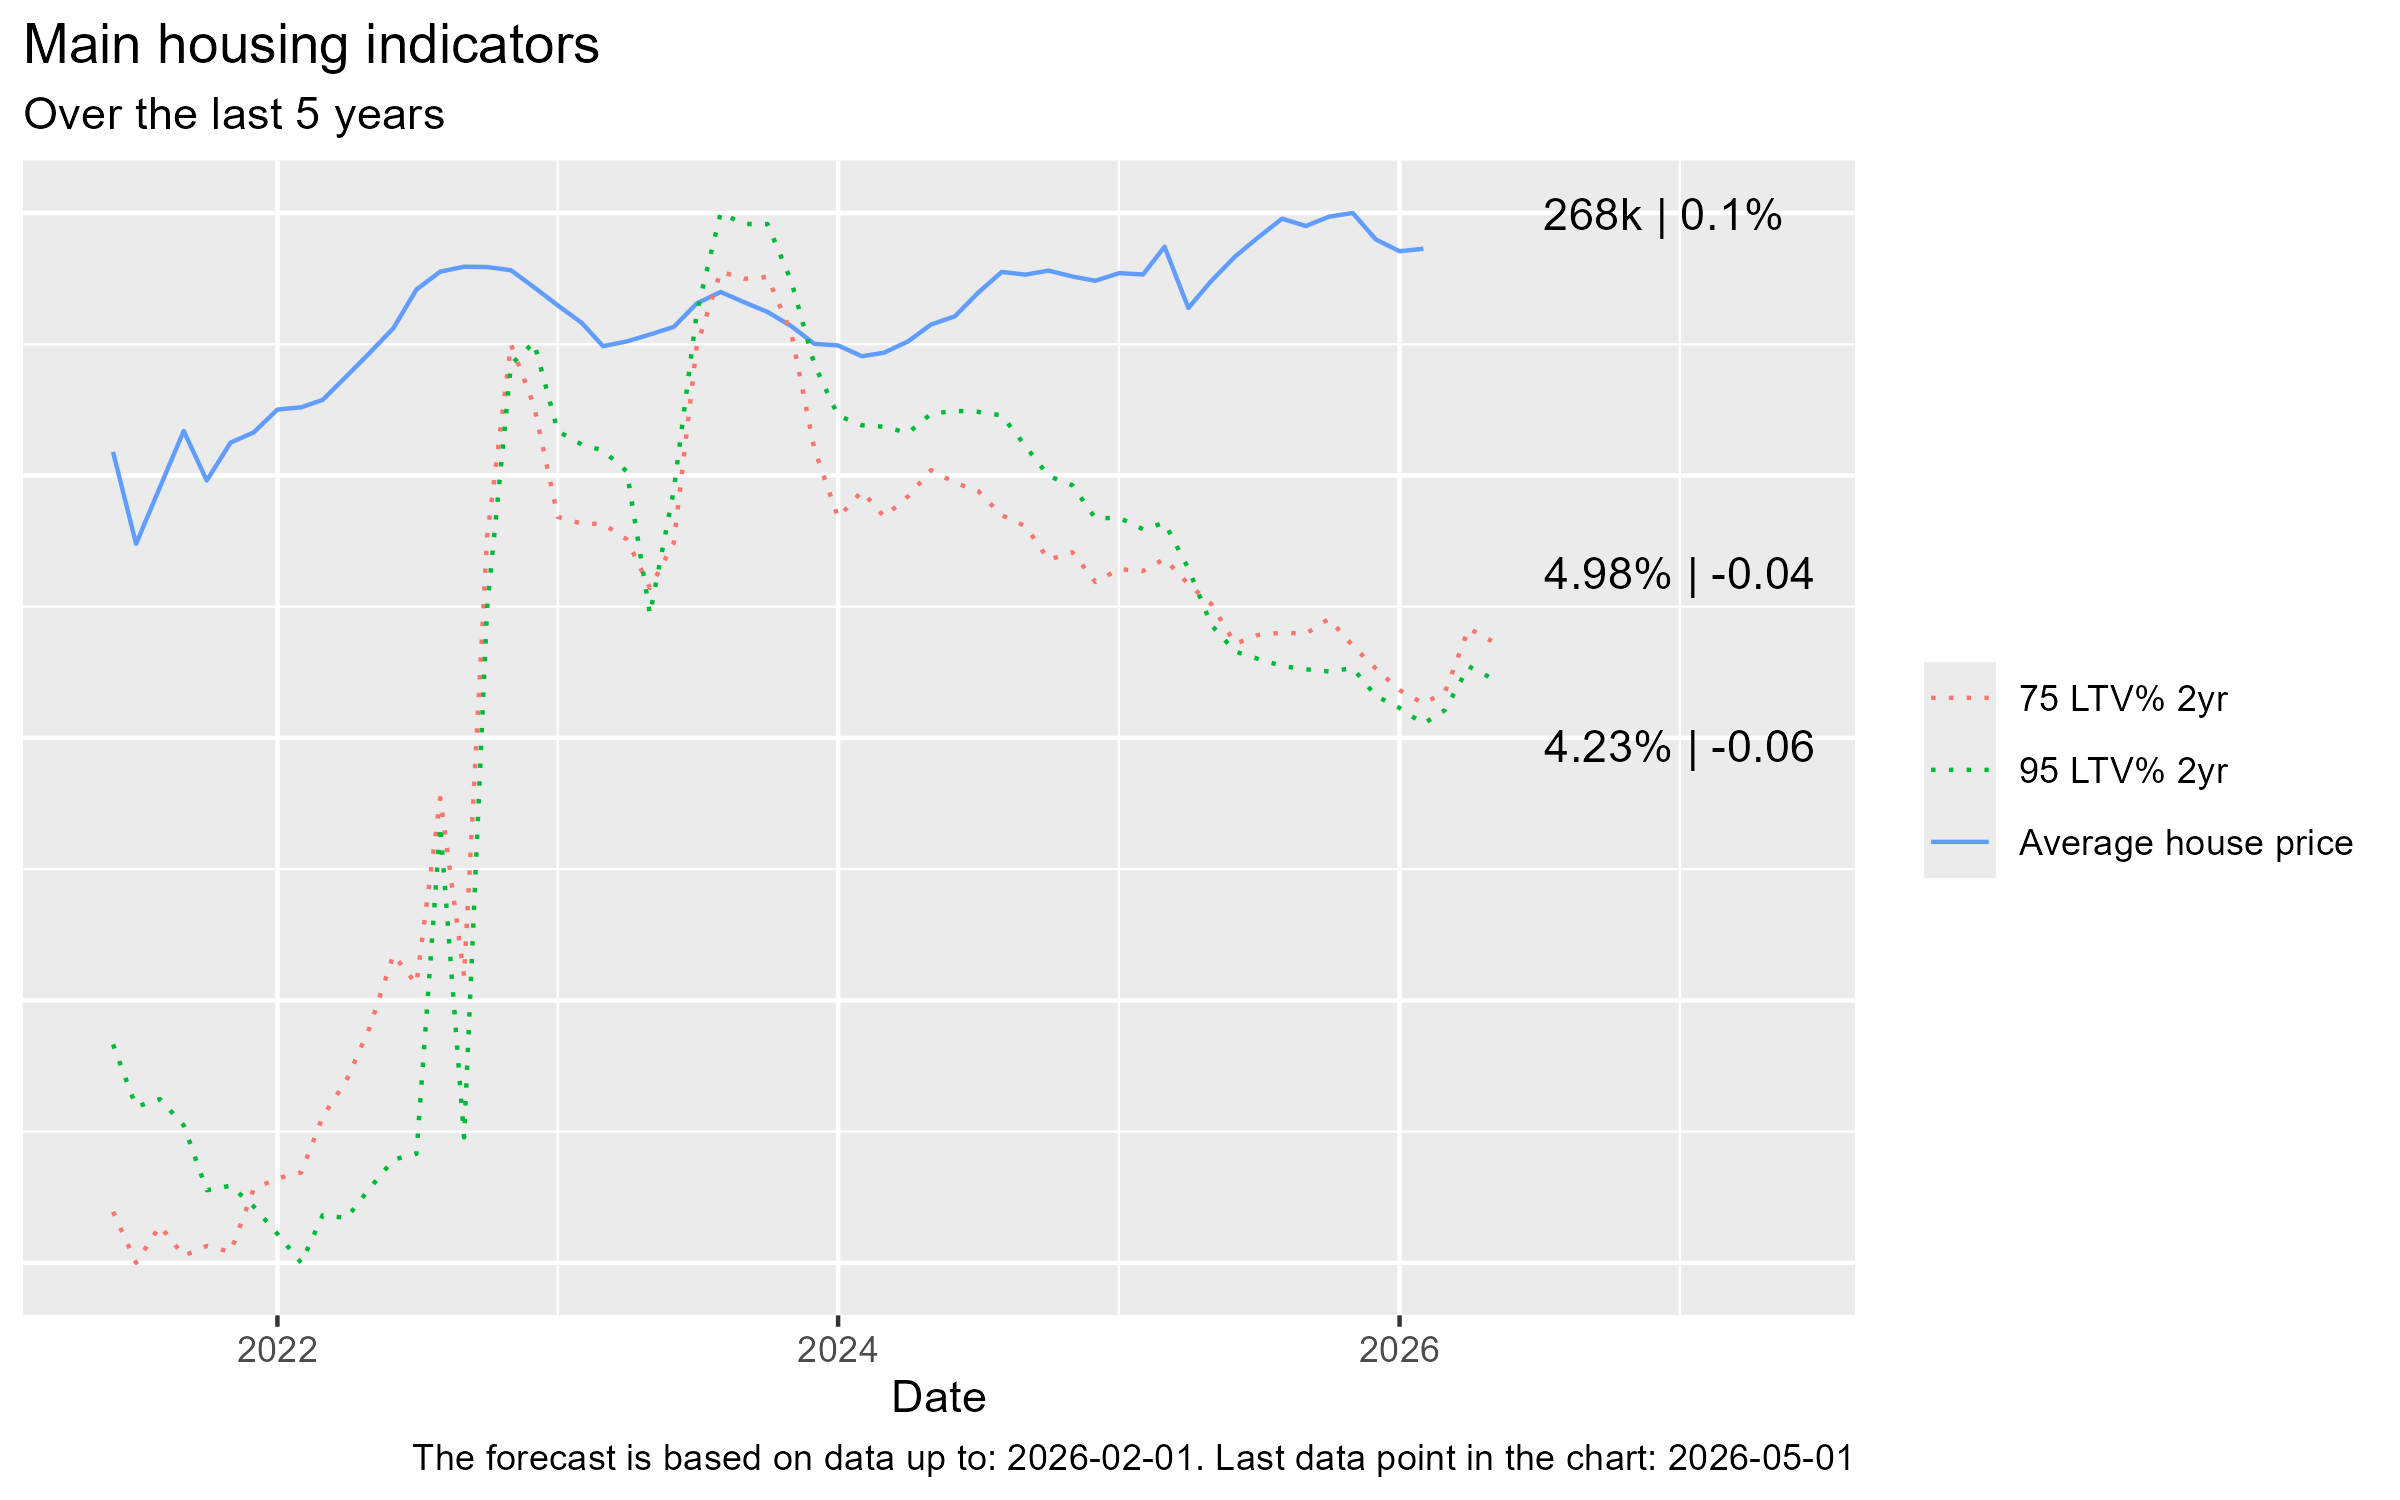
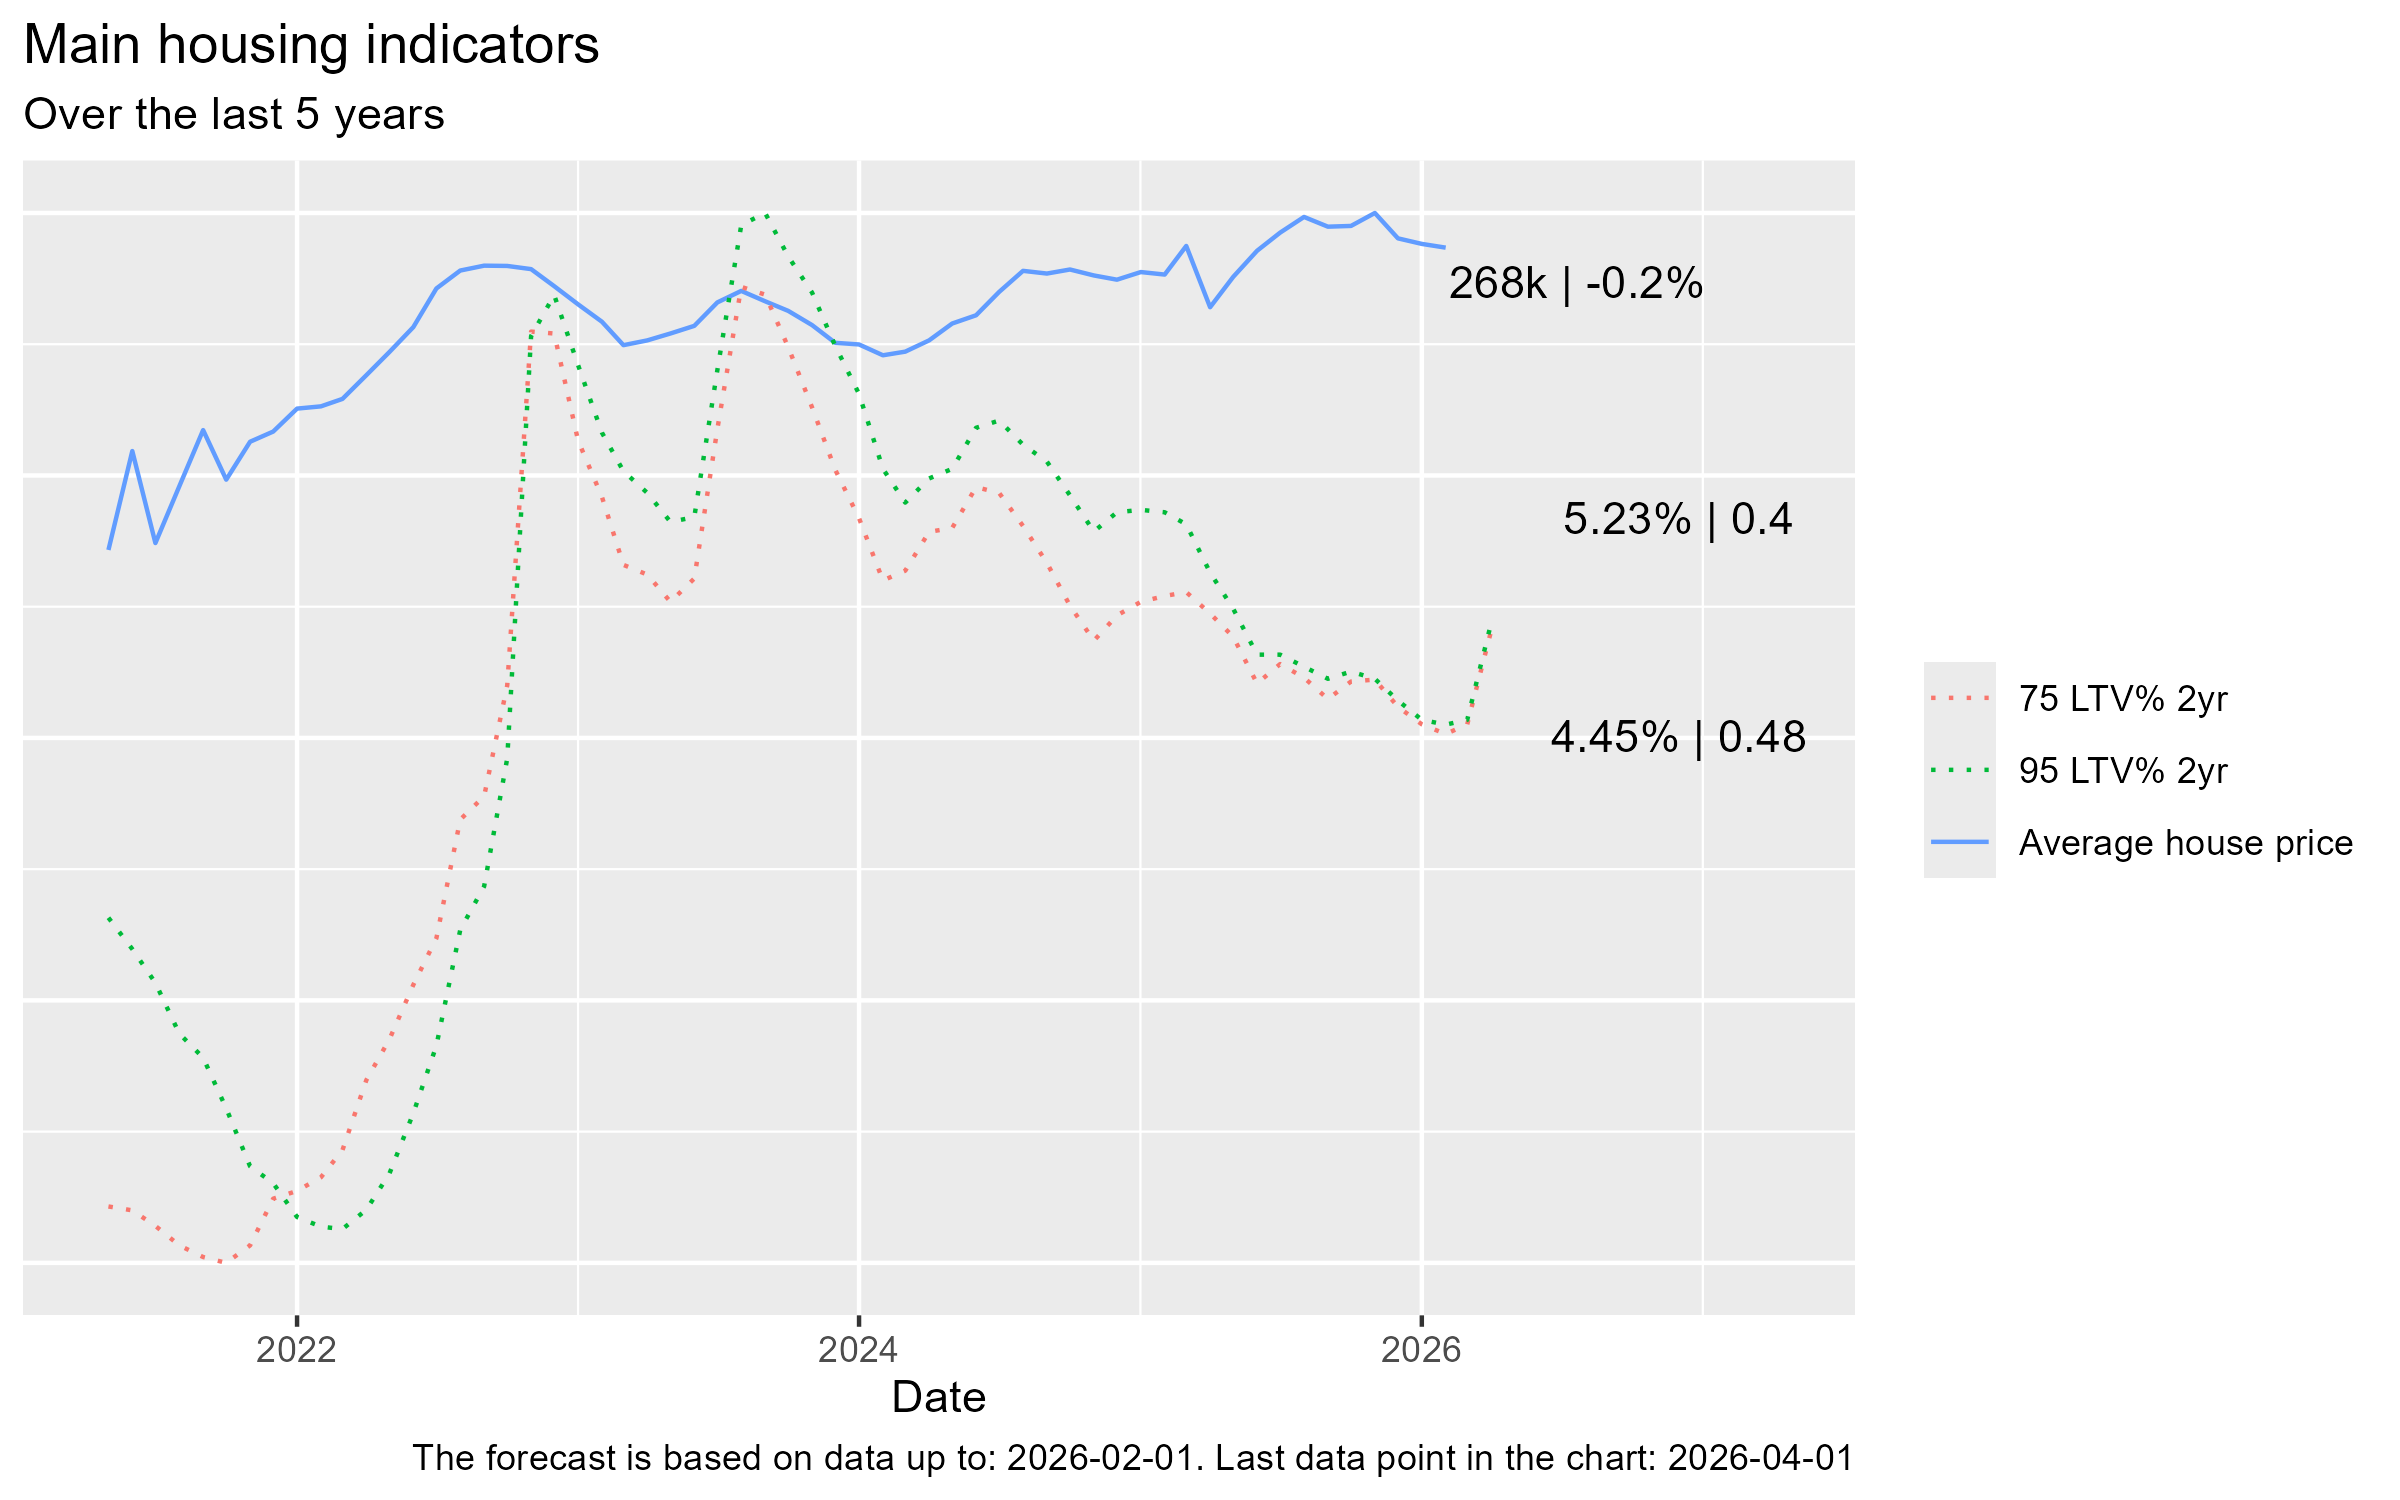
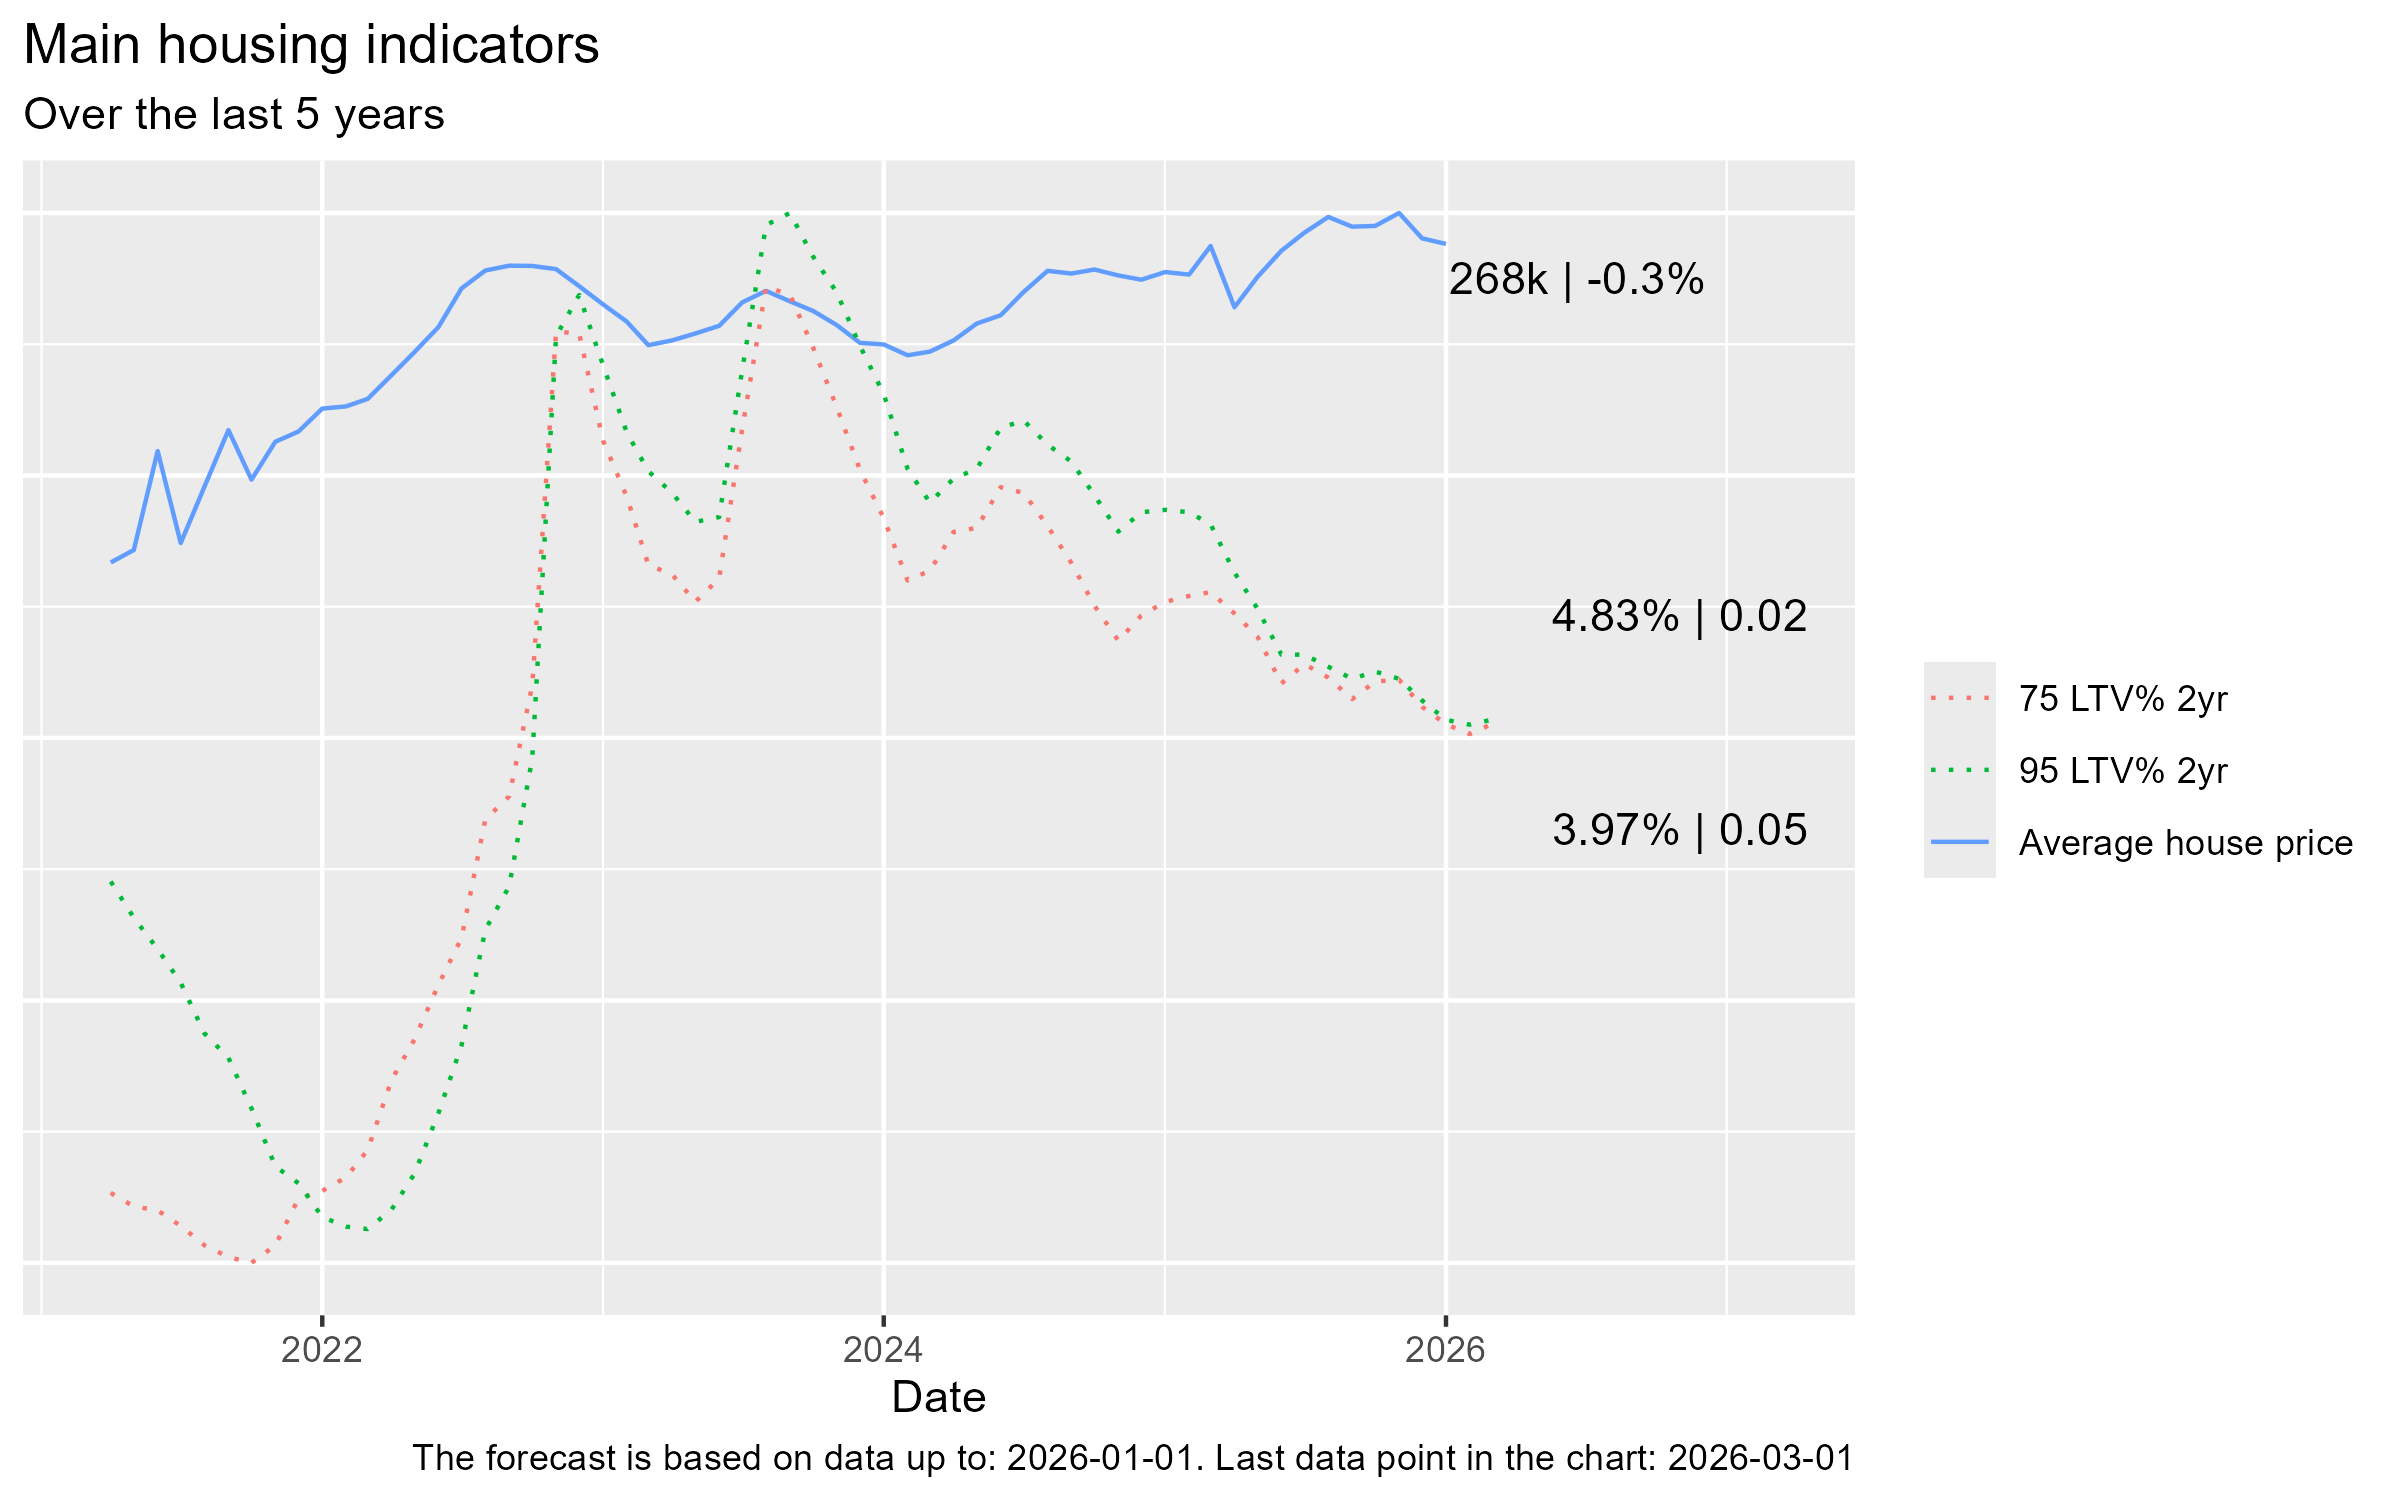
- Average house prices decreased very slightly to £268k on the previous month (-0.4%)
- The average 75% LTV 2-year mortgage rate eased slightly to 4.23%, whilst the average 95% LTV 2-year rate fell to 4.98%.
Home affordability
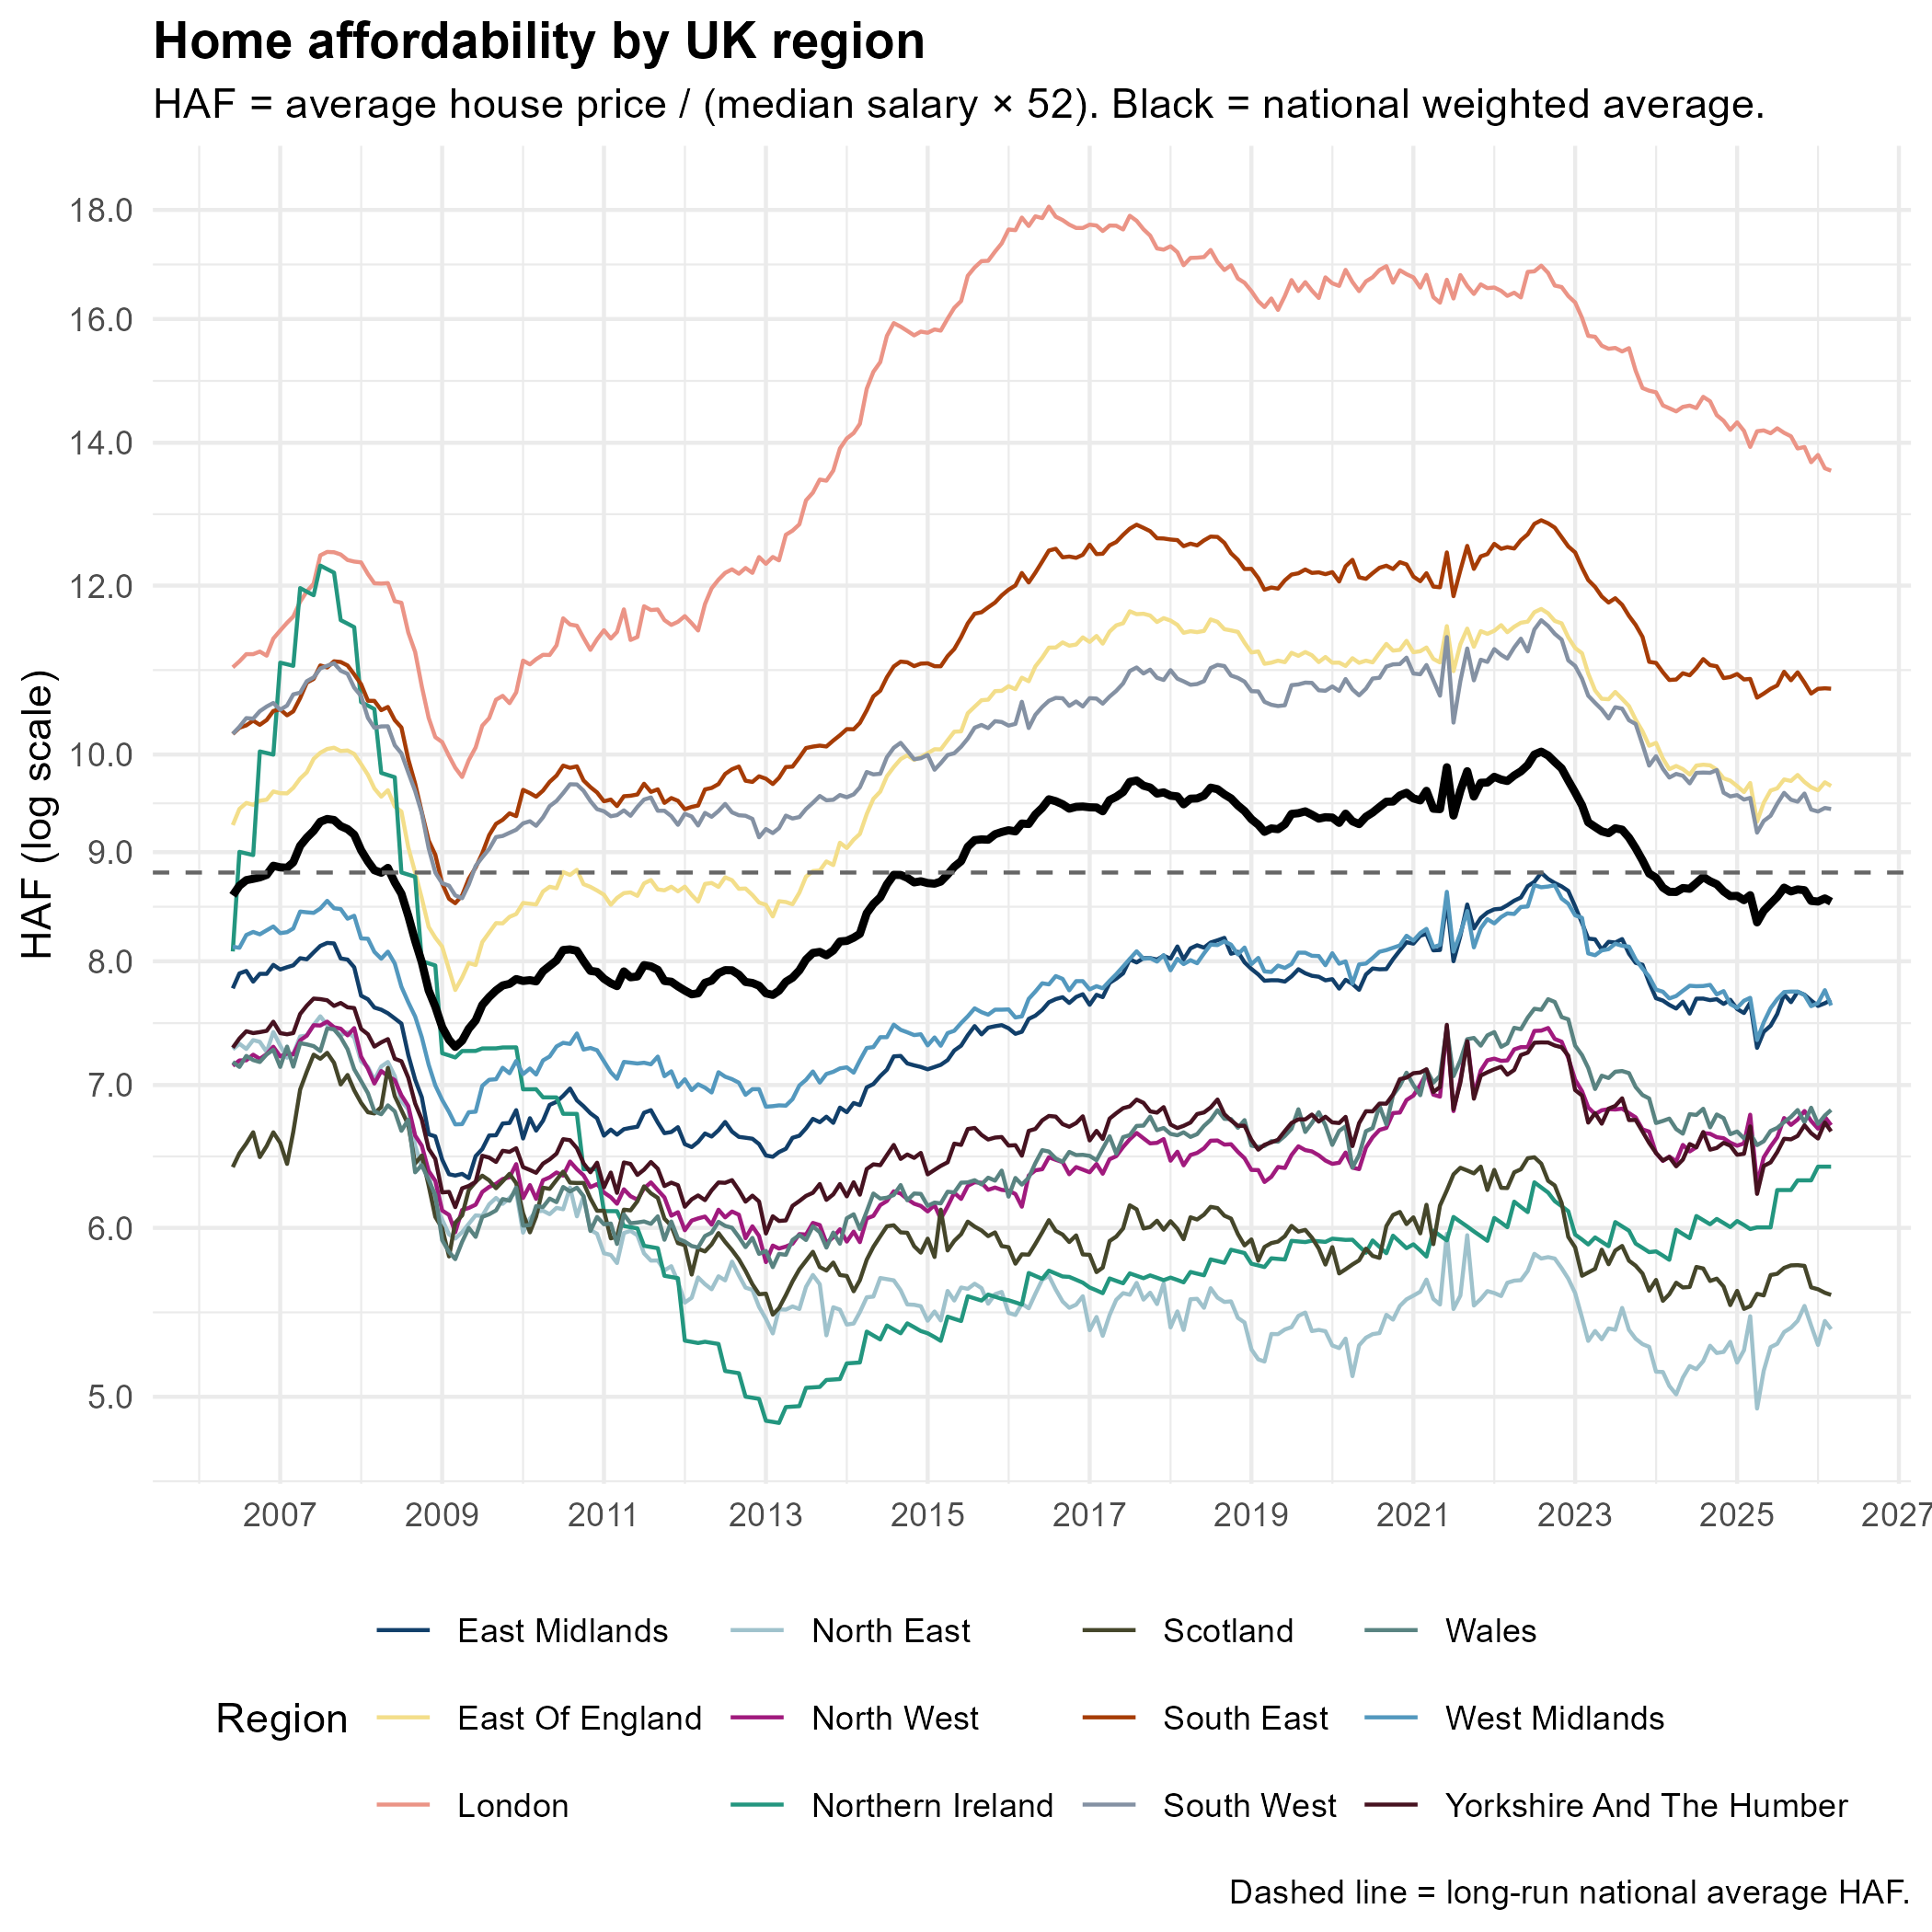
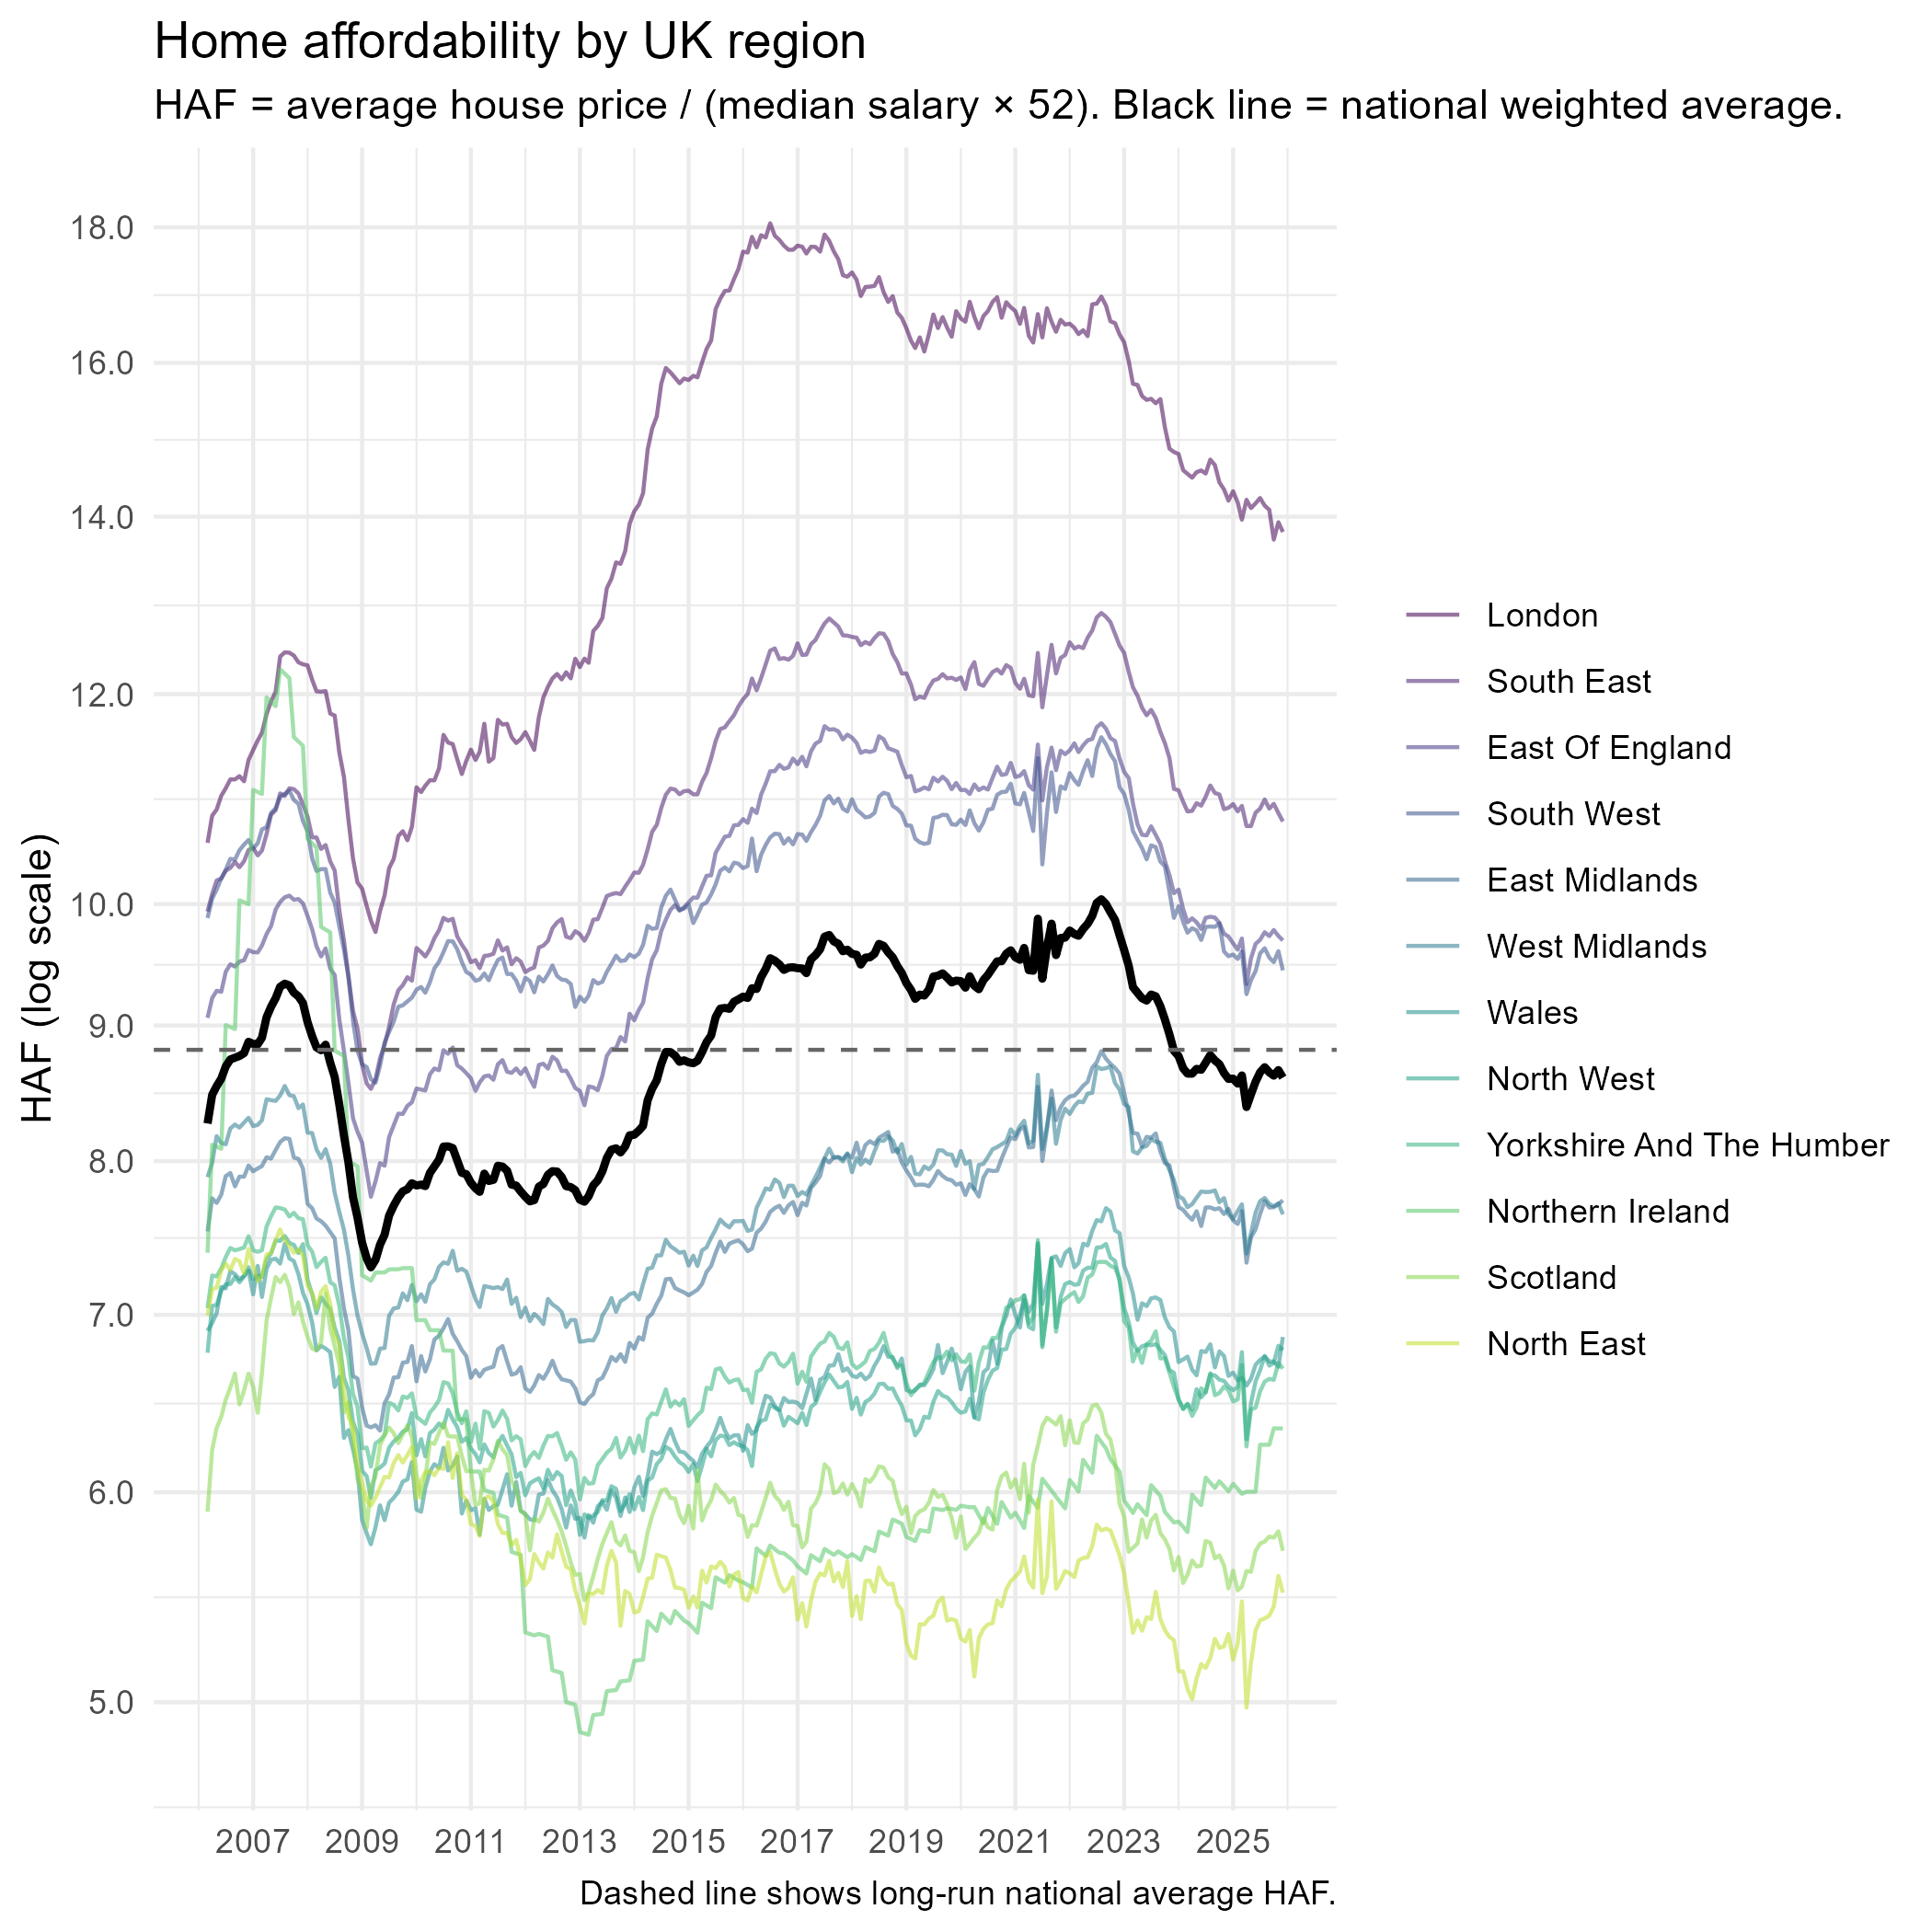
This month we are featuring the Home Affordability Factor (HAF), defined as average house price divided by median annual salary (median weekly salary × 52), tracked by region over nearly two decades. The national weighted average (black line) currently sits at approximately 8.8, back in line with the long-run historical mean (dashed line) after peaking at around 10.0 in 2022–23. London remains strikingly unaffordable at roughly 13.8 times annual salary, though this has fallen sharply from its peak of 18 in 2016, reflecting both price softening and wage growth. At the other end, Northern Ireland and Yorkshire and The Humber are among the most affordable regions at around 6.5, underpinning the demand momentum evident in their price growth figures.
Current growth rates
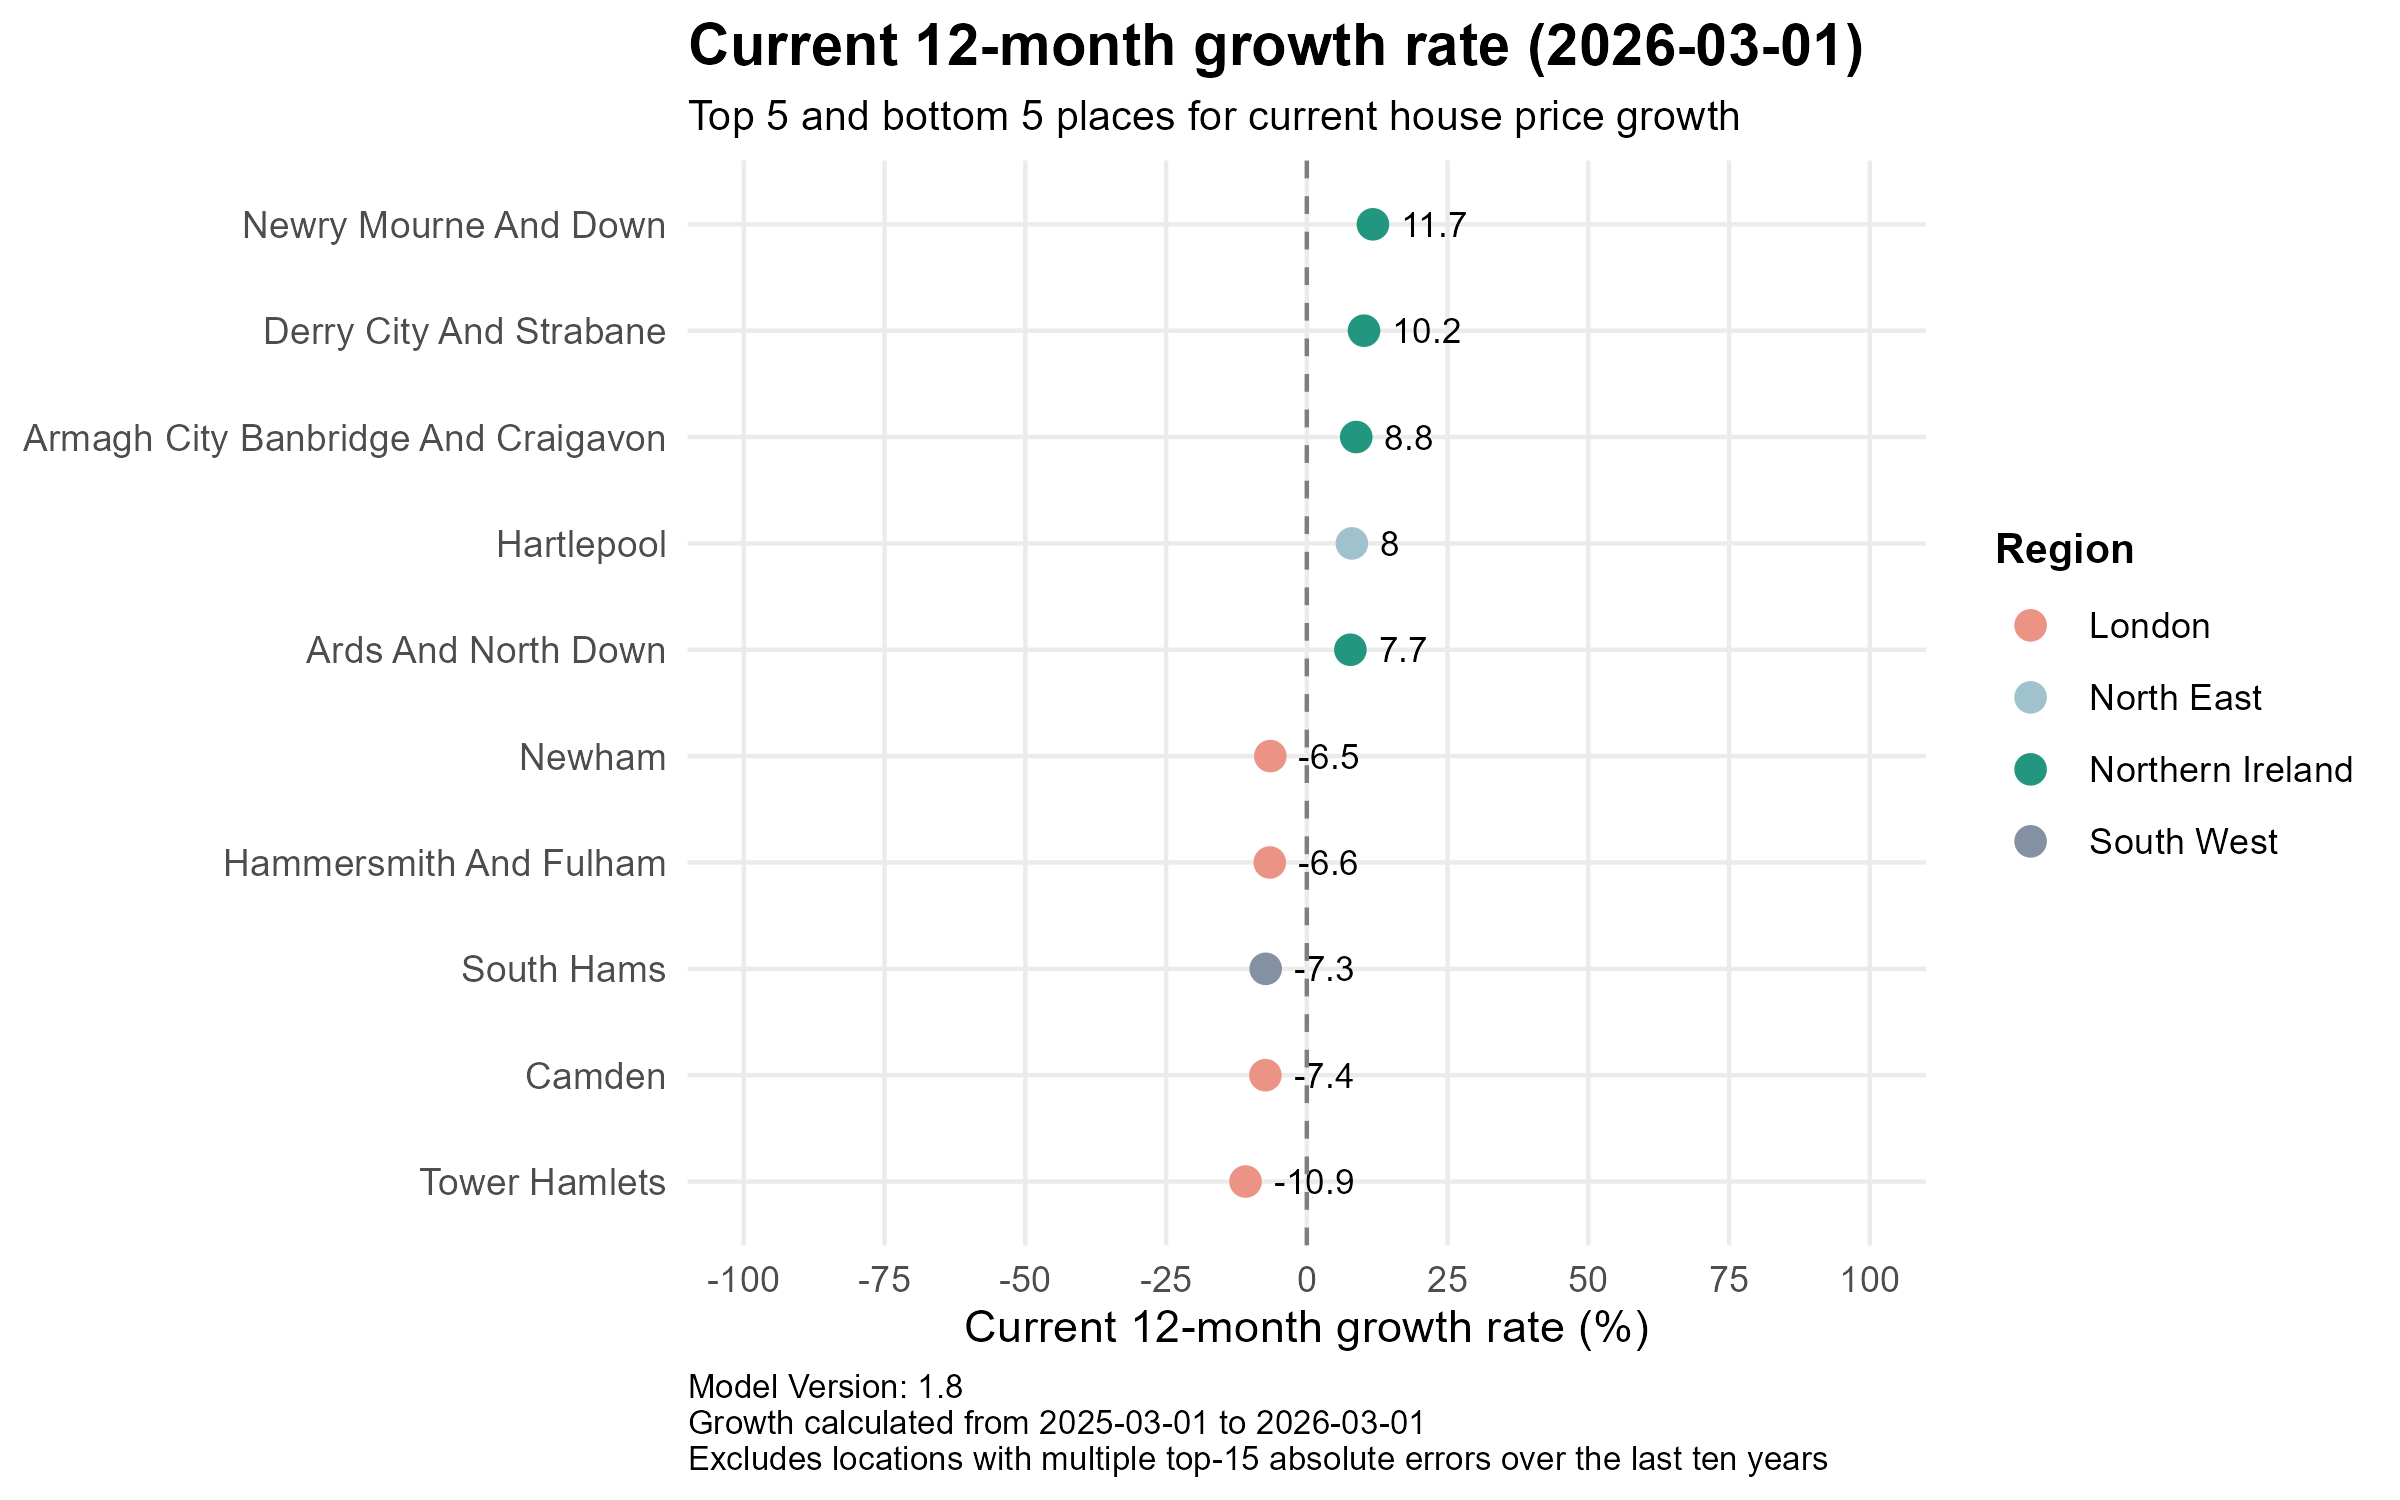
The north–south divergence in house price performance remains striking. Northern Ireland continues to lead all UK regions by a considerable margin, with four of the top five fastest-growing local areas drawn from the province. Newry Mourne and Down tops the table with a 12-month growth rate of +11.7%, followed by Derry City and Strabane (+10.2%), Armagh City Banbridge and Craigavon (+8.8%) and Ards and North Down (+7.7%), with Hartlepool (+8.0%) in the North East the sole English entry. The contrast with London is stark: Tower Hamlets (-10.9%), Camden (-7.4%), South Hams in the South West (-7.3%), Hammersmith and Fulham (-6.6%) and Newham (-6.5%) occupy the five weakest positions, underscoring that affordability stress and elevated mortgage rates continue to bite hardest in high-value urban and coastal markets.
Predictions
Overall
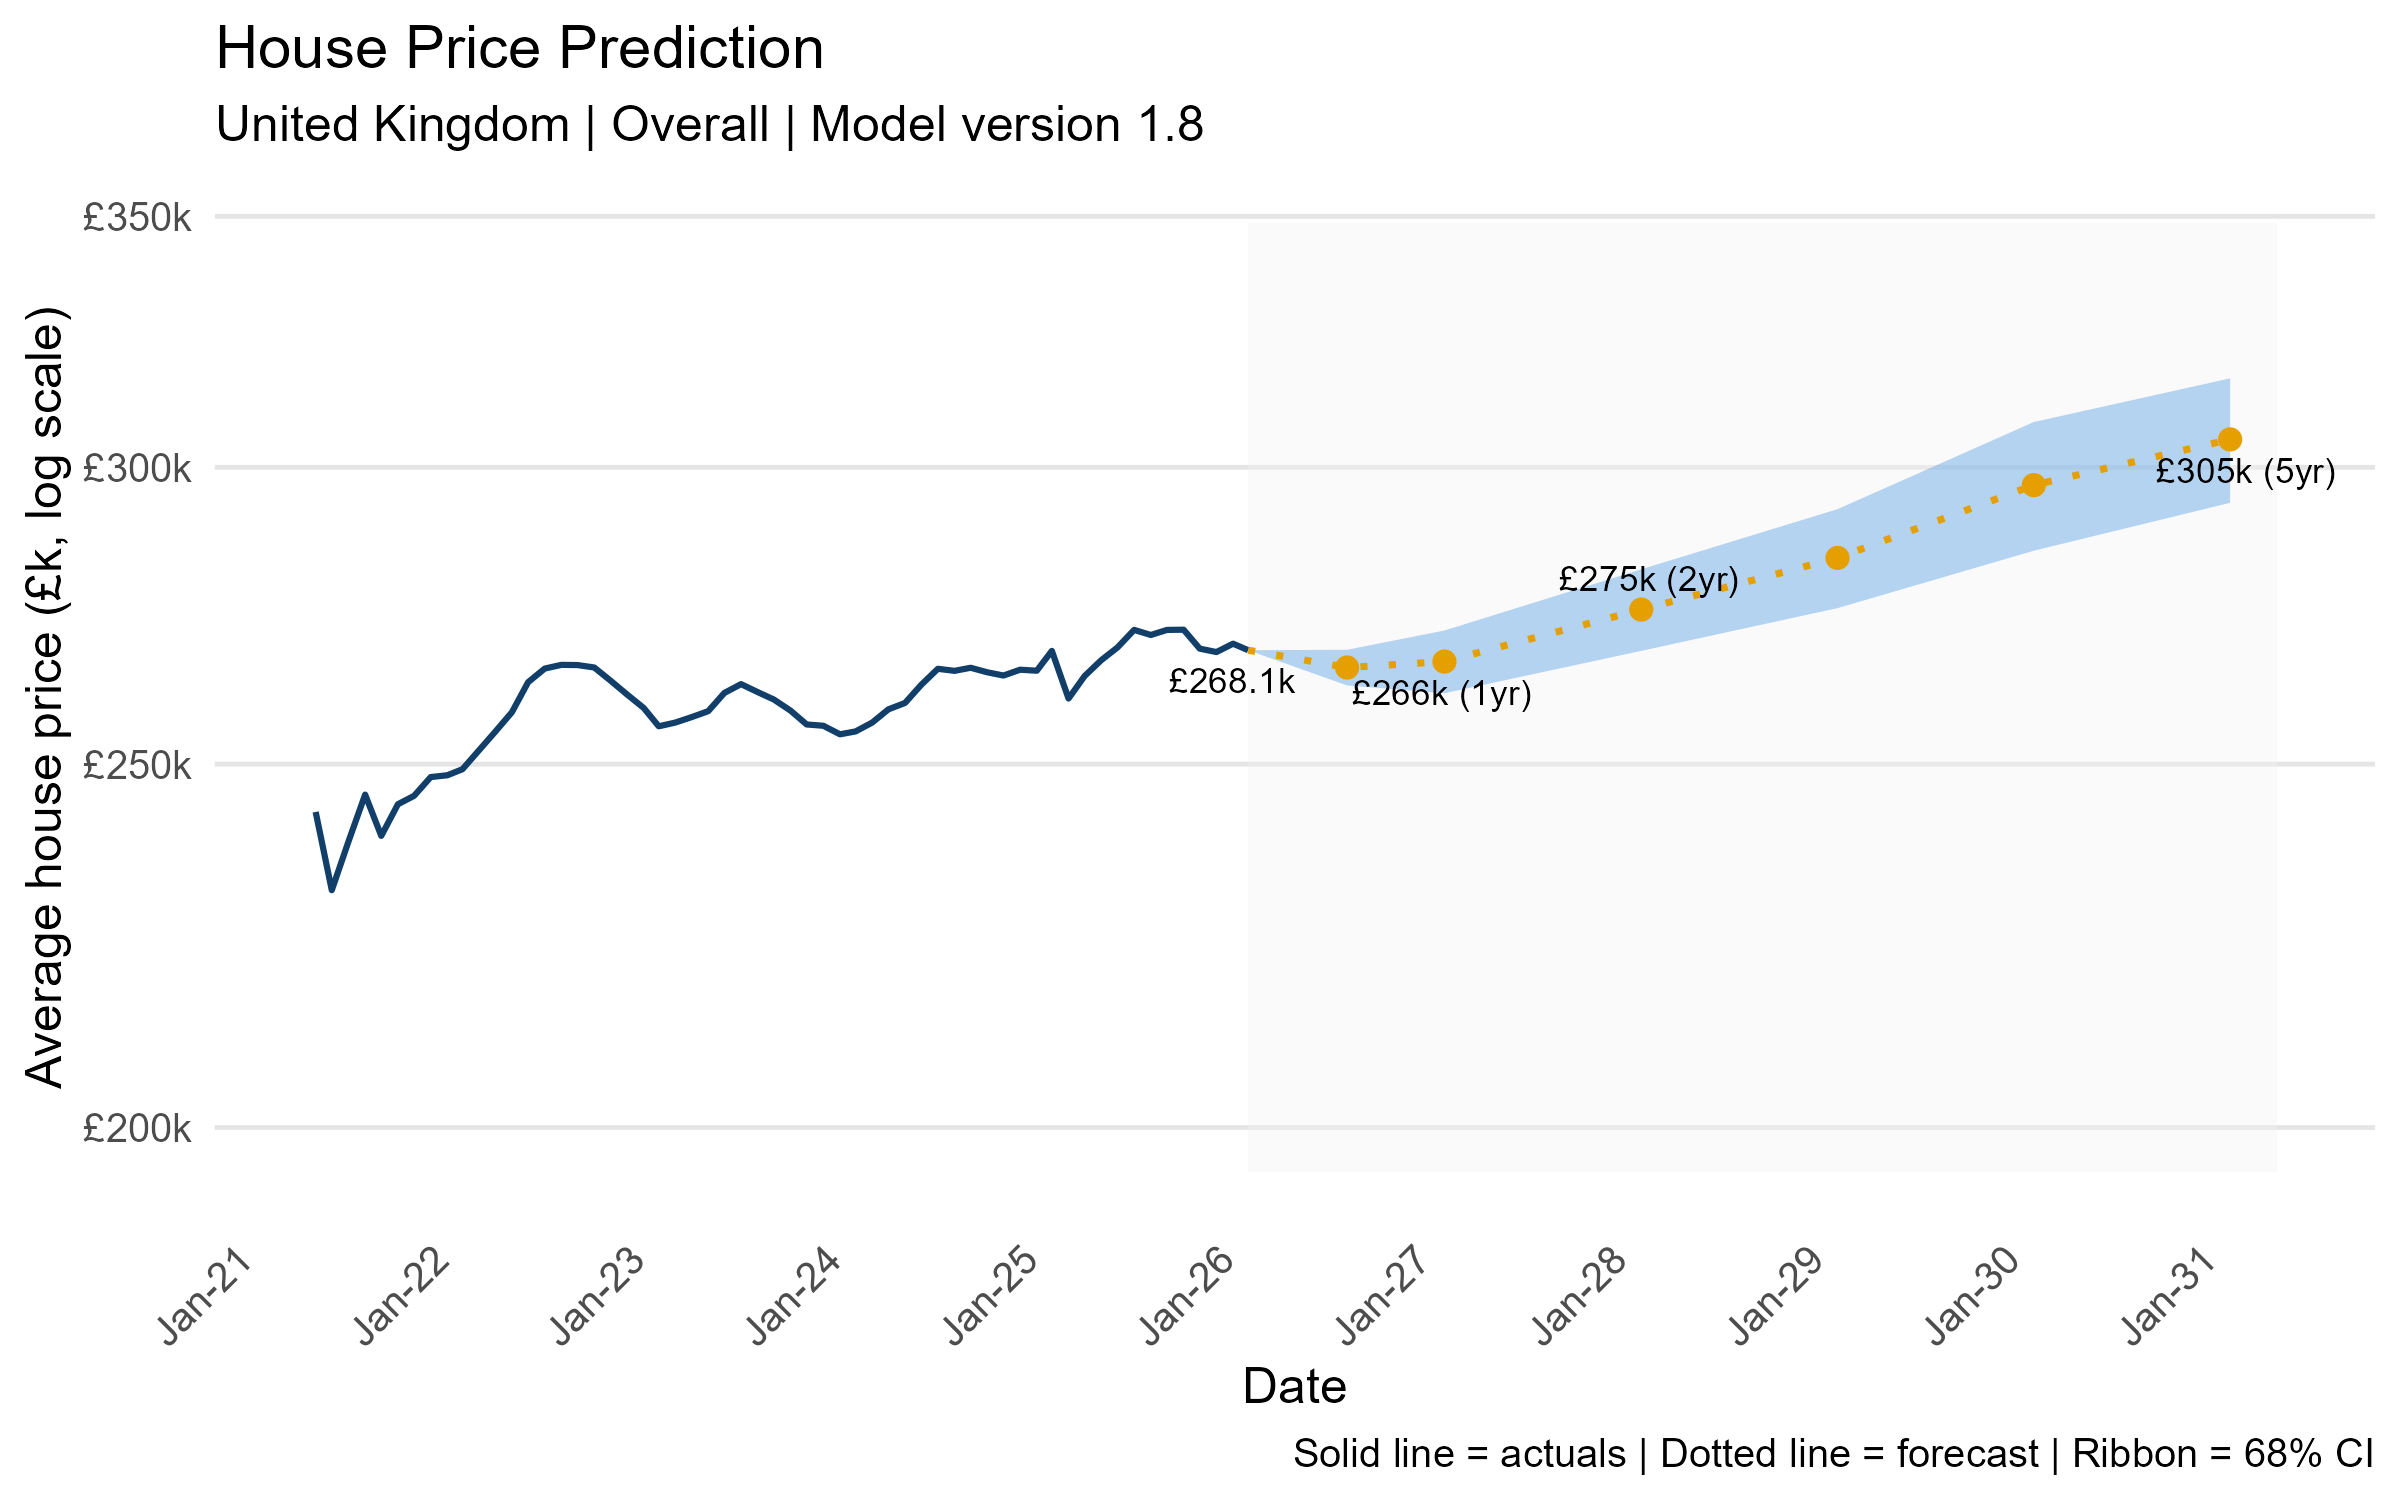
The model projects a modest near-term dip before recovery resumes. From the current average of £268.1k, prices are forecast to ease marginally to £266k within one year before rebounding to £275k by 2028 and reaching £305k by March 2031 — representing cumulative growth of approximately 14% over five years. The widening confidence interval beyond the two-year horizon reflects the genuine uncertainty posed by the geopolitical and macroeconomic environment.
Regional
Short term (years 1–2): Northern Ireland is the clear standout in the near term, with overall prices forecast to grow 2.9% in year one and 5% by year two, the strongest short-term trajectory of any region. By contrast, London and Scotland are the only regions forecast to record negative growth in year one (-1.6% and -2.1% respectively), with London only fractionally recovering to -0.3% by year two.
Medium term (years 3–4): The picture brightens meaningfully across most regions by years three and four, with Northern Ireland accelerating strongly to 8% and 15% cumulative growth respectively — the fastest of any region. Yorkshire and The Humber, Wales and the North West all reach 6–7% by year three and 11–13% by year four, while London finally turns positive in year three, reaching around 9% by year four as the correction fades.
Long term (year 5): Northern Ireland leads the five-year rankings at +14%, closely followed by Wales (+13%) and Yorkshire and The Humber (+12%). The North West, East Midlands and North East all achieve double-digit gains of 11–12%. London and Scotland lag the national picture with 5-year cumulative growth of 8%, solid but well below the affordable northern and Irish markets that have driven the rebalancing story throughout this forecast period.
Local
12-month prediction (to March 2027)
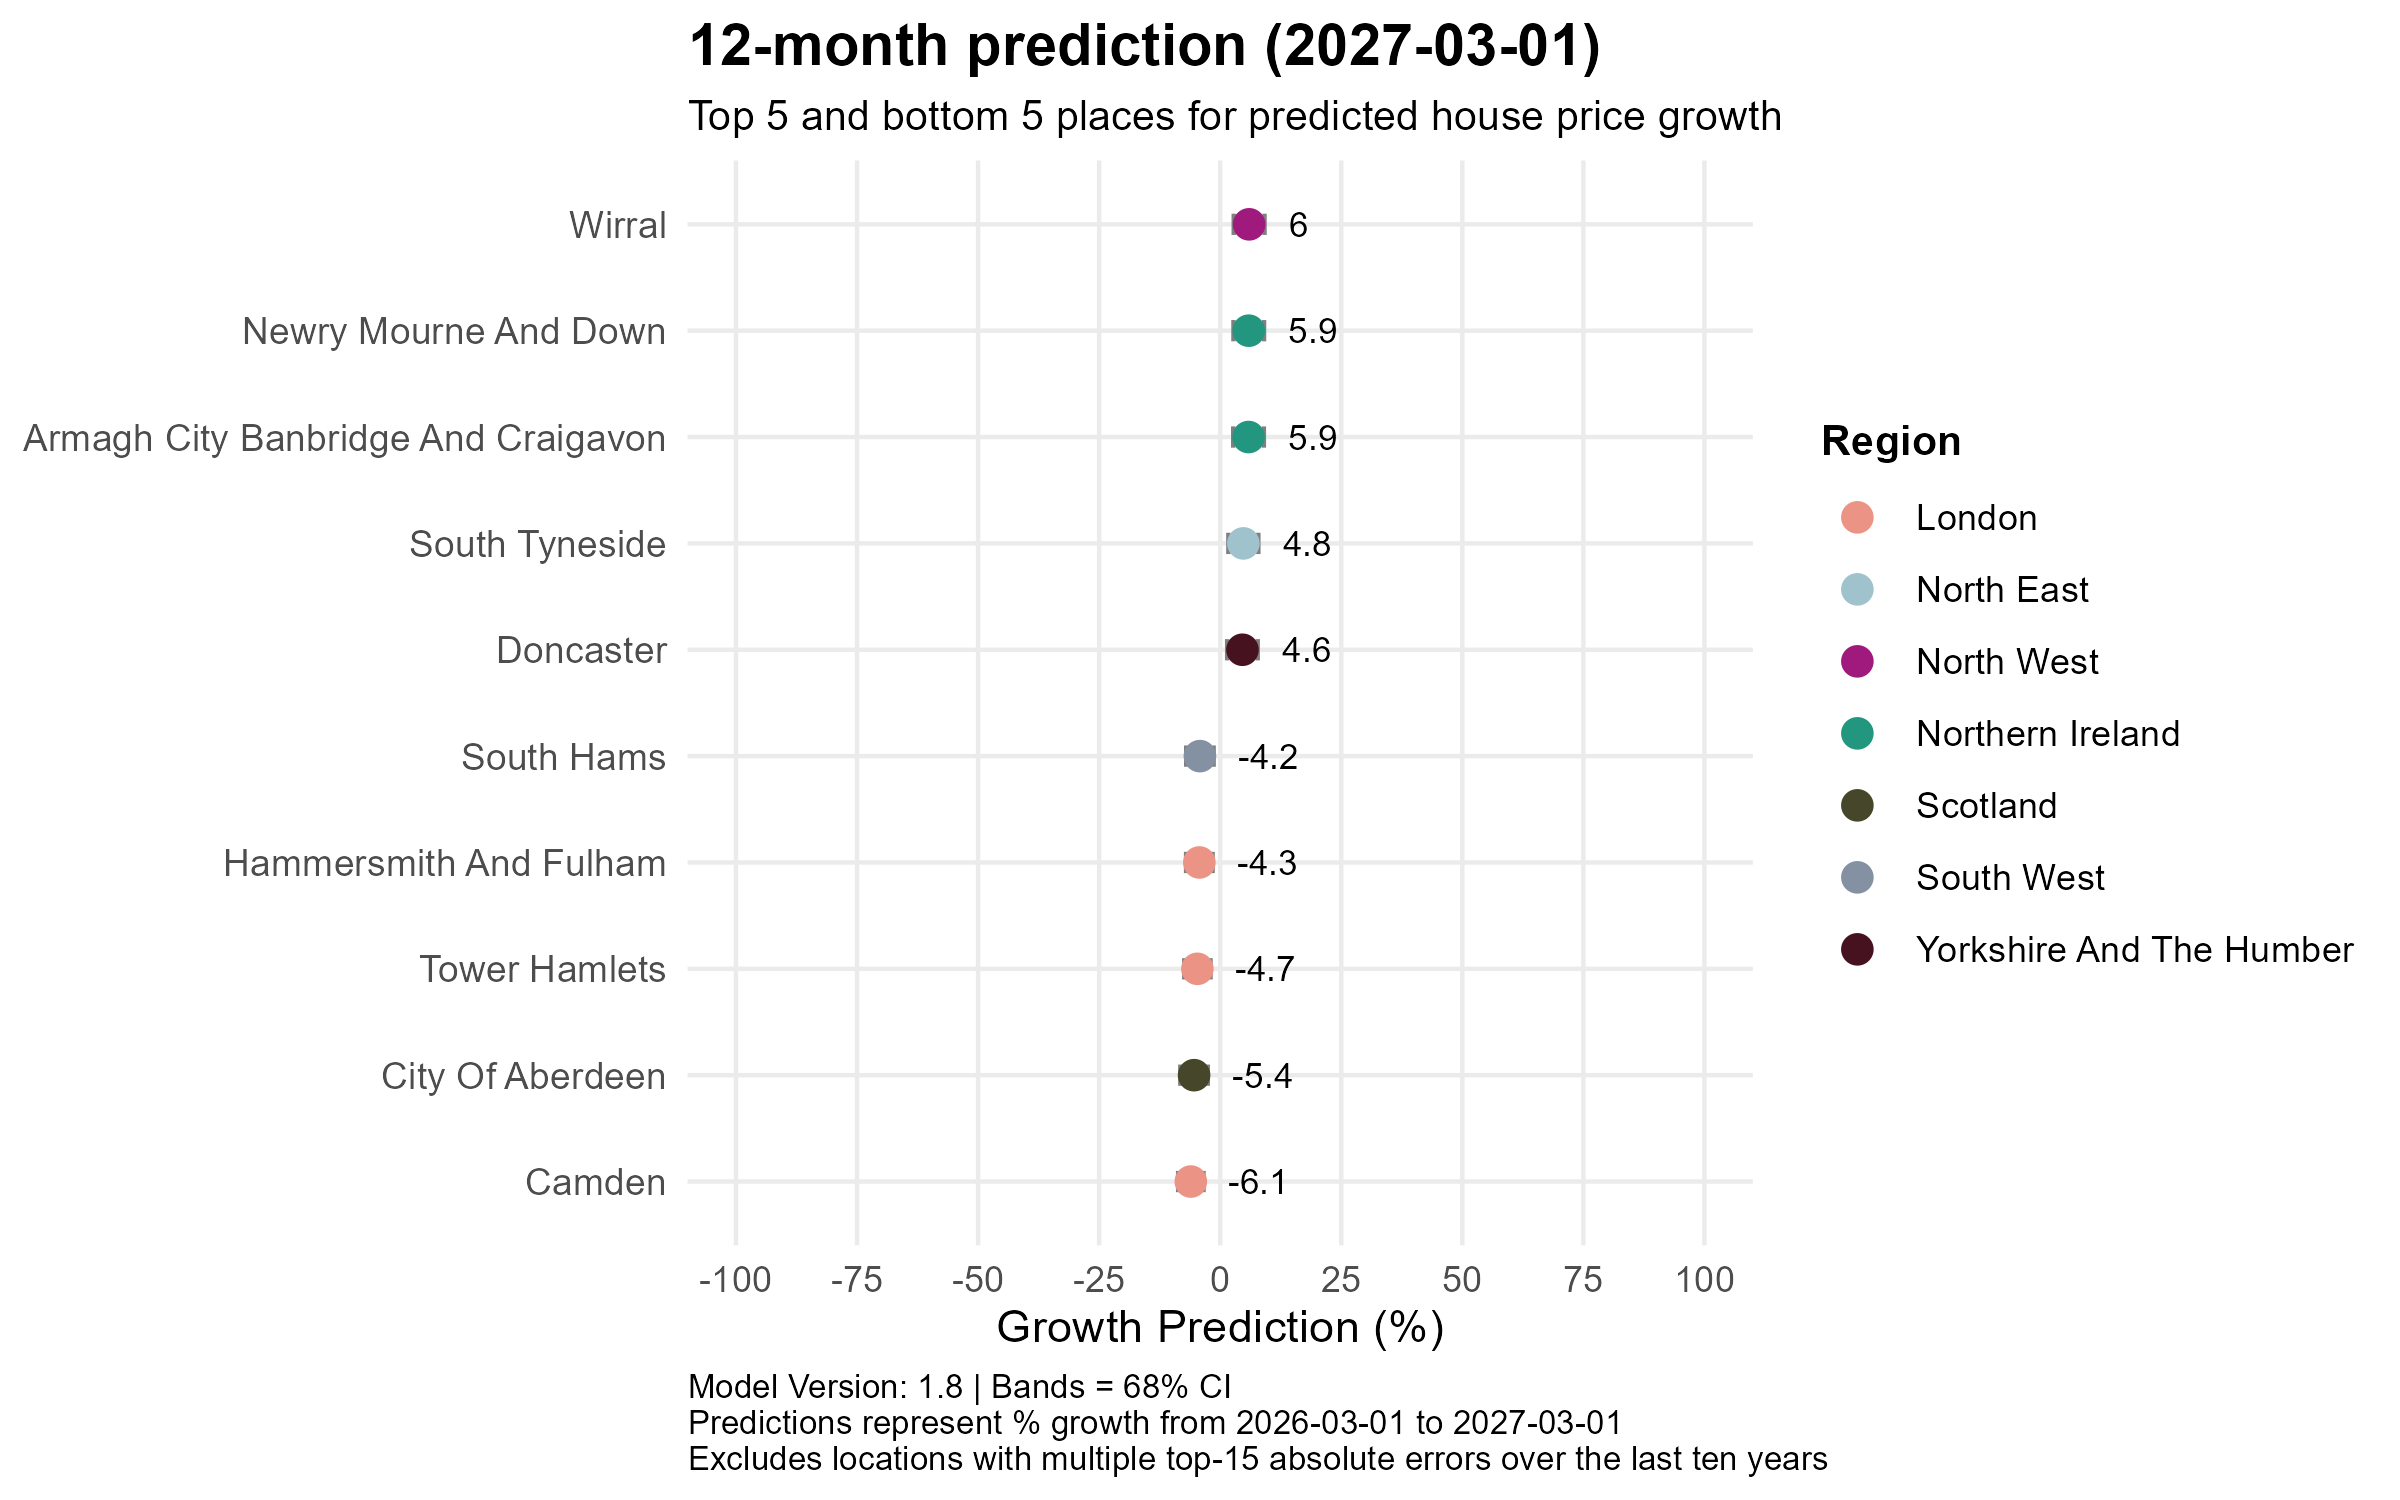
The short-term picture is dominated by Northern Ireland and the affordable North. Wirral in the North West leads the one-year predictions at +6.0%, closely followed by Newry Mourne and Down (+5.9%) and Armagh City Banbridge and Craigavon (+5.9%) in Northern Ireland, with South Tyneside (+4.8%) and Doncaster (+4.6%) rounding out the top five, a line-up drawn entirely from Merseyside, Northern Ireland, the North East and Yorkshire. The bottom five remain stubbornly London-centric: Camden is forecast to fall the most sharply at -6.1%, followed by City of Aberdeen (-5.4%), Tower Hamlets (-4.7%), Hammersmith and Fulham (-4.3%) and South Hams in Devon (-4.2%), though losses are notably more moderate than the current 12-month actuals suggest the worst of the correction may already be passing.
24-month prediction (to March 2028)
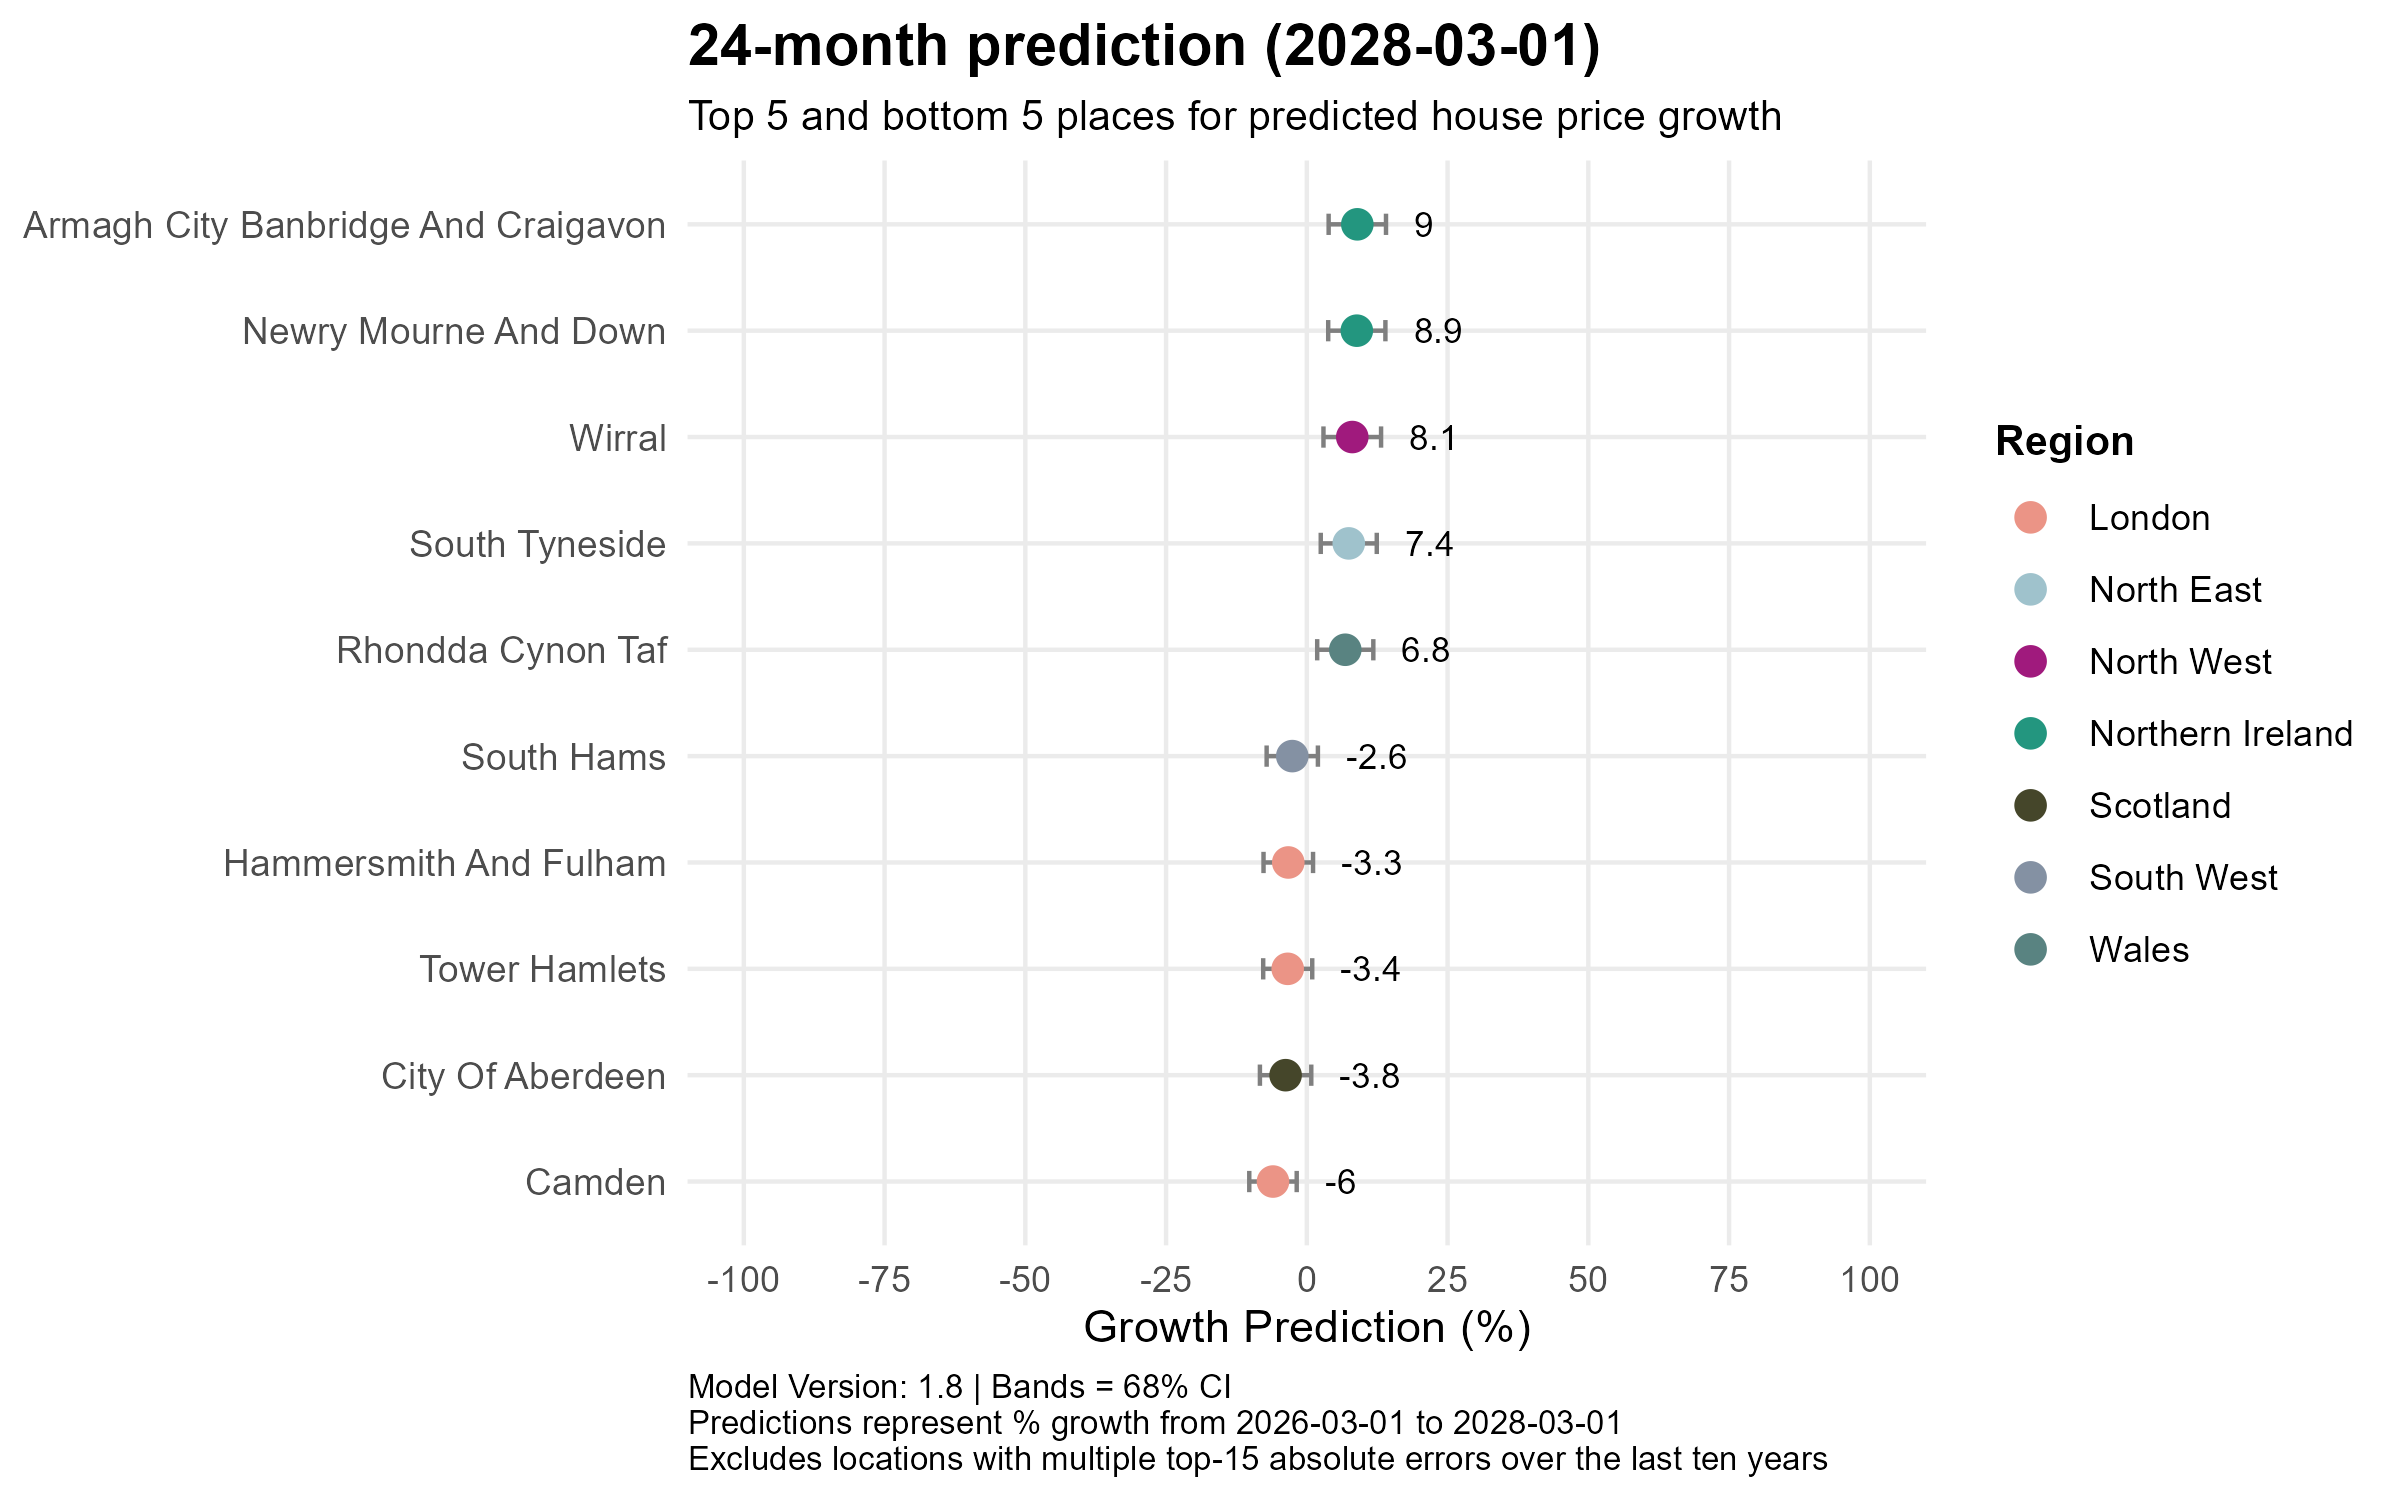
By the two-year horizon, Northern Ireland strengthens its grip at the top, with Armagh City Banbridge and Craigavon (+9.0%) and Newry Mourne and Down (+8.9%) leading, joined by Wirral (+8.1%), South Tyneside (+7.4%) and reflecting Wales’s improving momentum Rhondda Cynon Taf (+6.8%), marking its first appearance in the top five. The bottom five remain consistent: Camden (-6.0%), City of Aberdeen (-3.8%), Tower Hamlets (-3.4%), Hammersmith and Fulham (-3.3%) and South Hams (-2.6%), though the magnitude of the losses is moderating compared to the 12-month view, suggesting the worst pressures are beginning to ease in high-value southern markets.
60-month prediction (to March 2031)
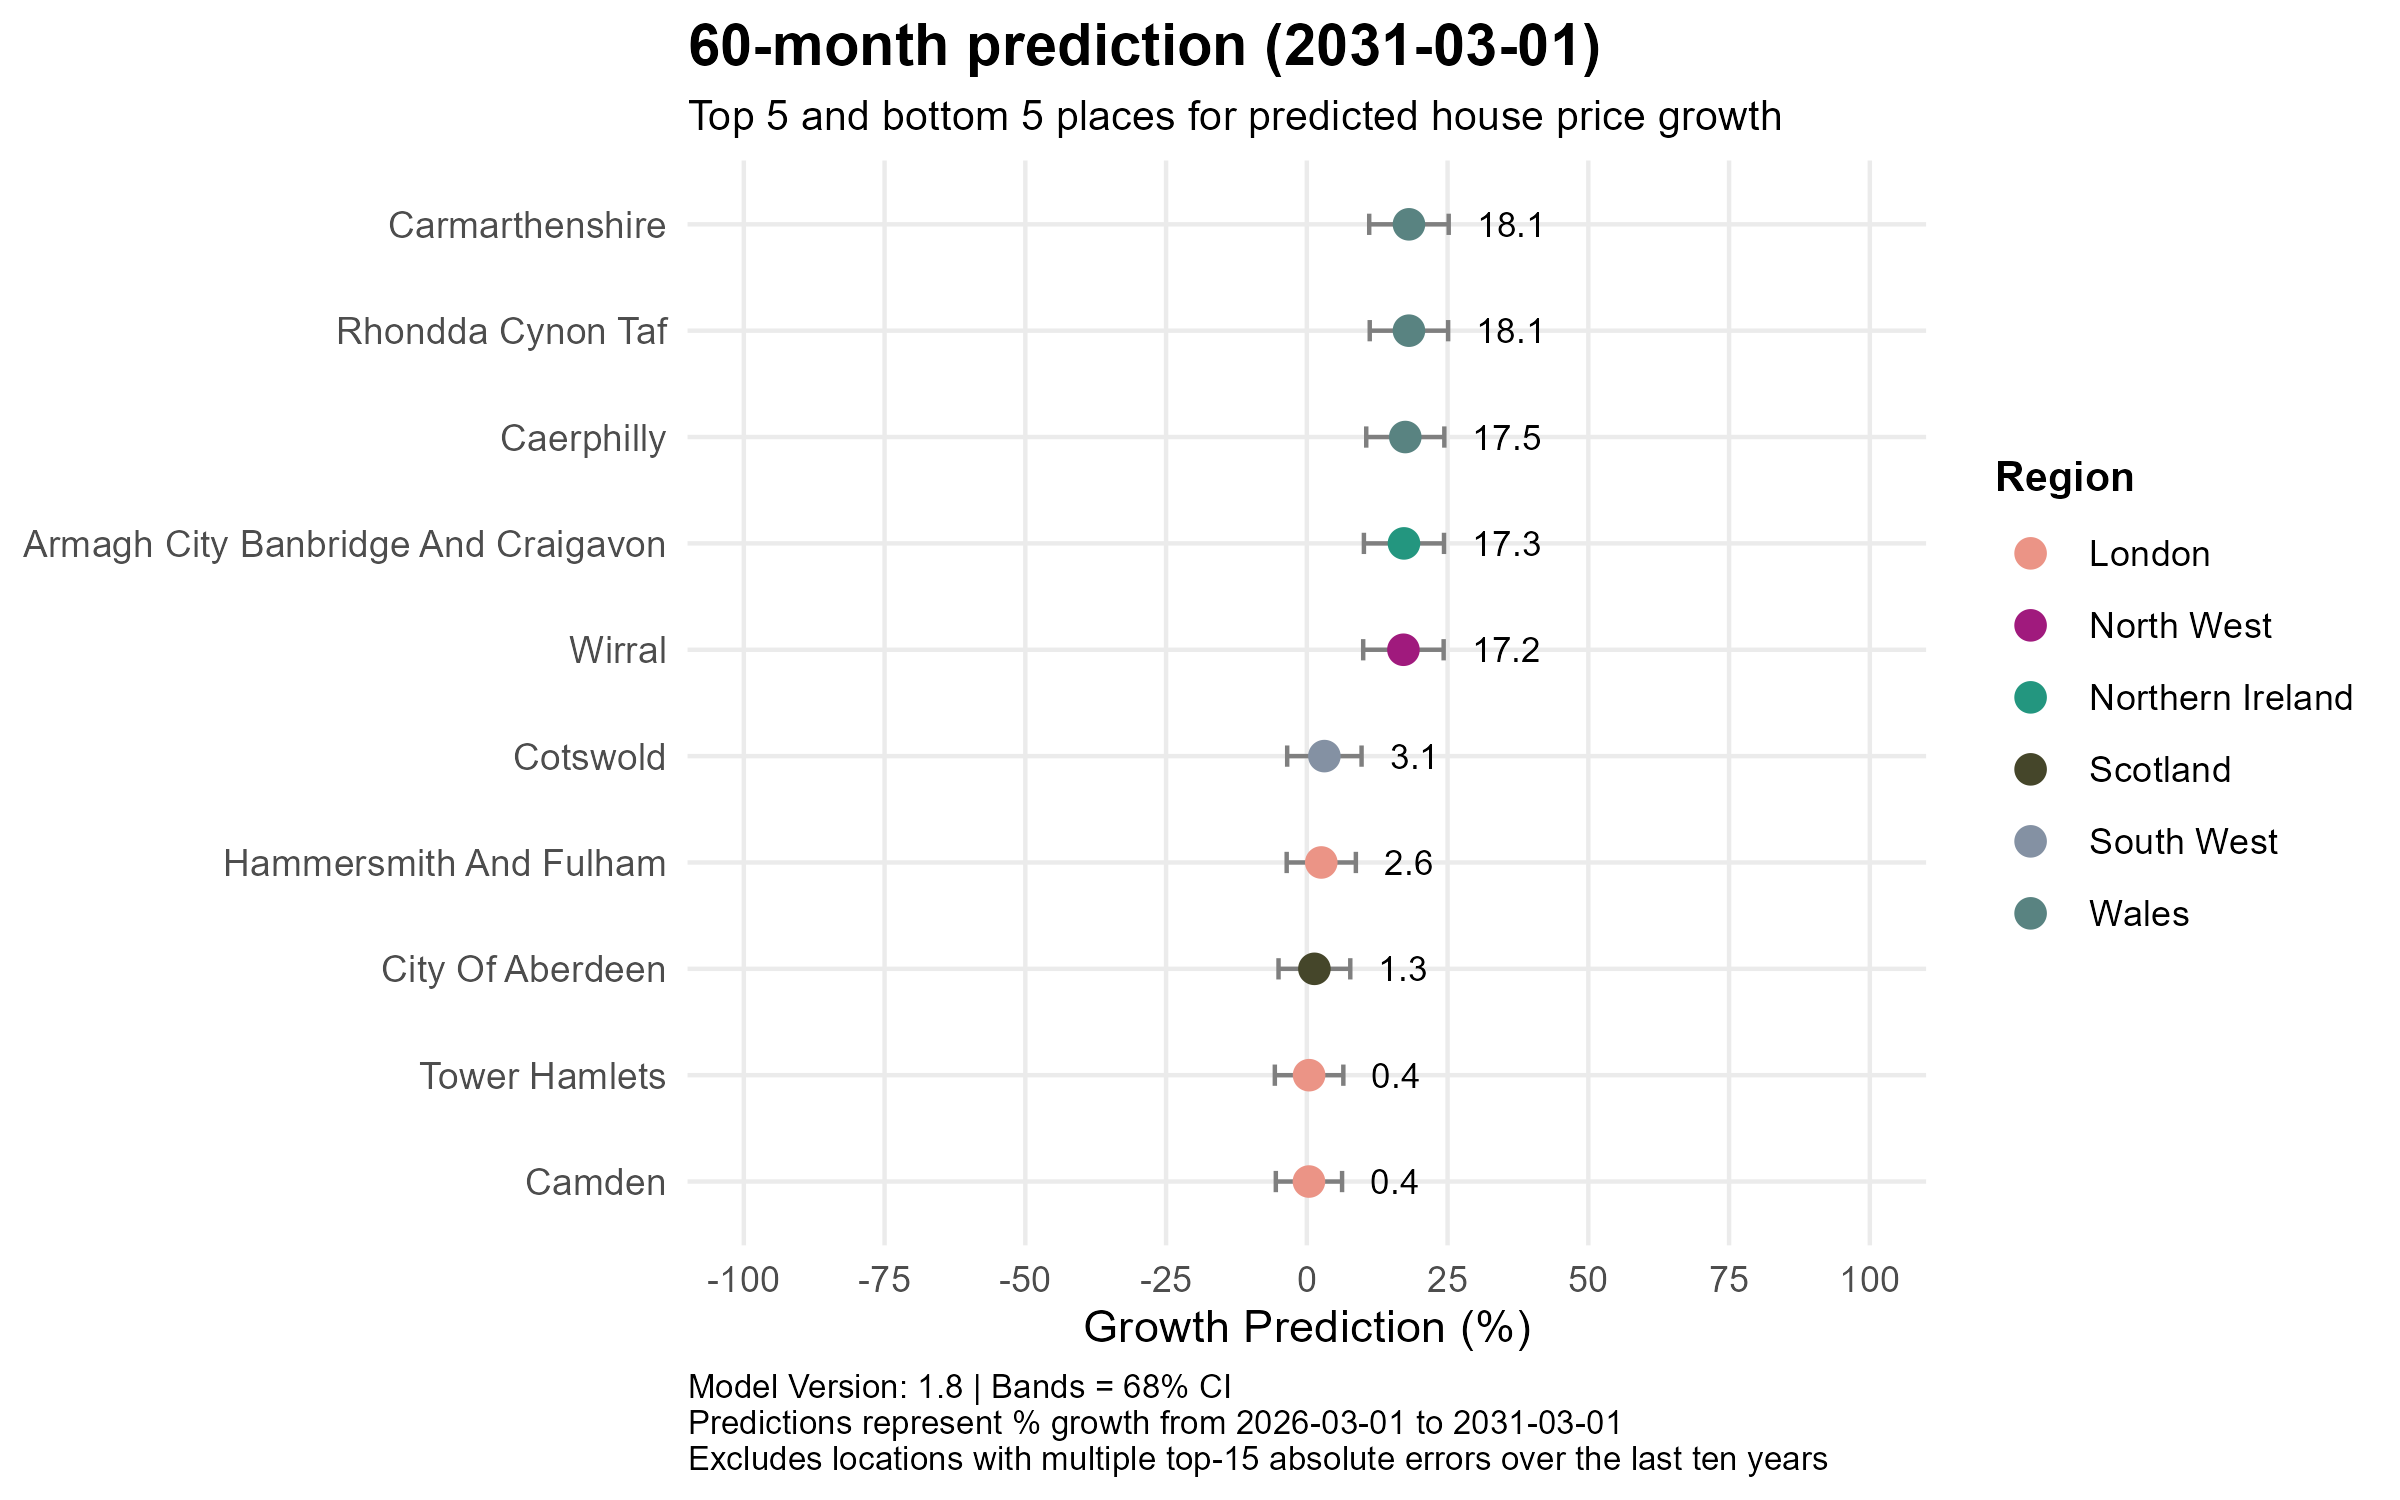
The five-year view brings a dramatic shift in composition, with Welsh authorities surging to the top of the leaderboard. Carmarthenshire and Rhondda Cynon Taf both top the rankings at +18.1%, joined by Caerphilly (+17.5%), all in Wales, alongside Armagh City Banbridge and Craigavon (+17.3%) in Northern Ireland and Wirral (+17.2%) in the North West. Crucially, even the long-term laggards are now forecast to post positive gains: Camden and Tower Hamlets both reach +0.4%, Hammersmith and Fulham +2.6%, and City of Aberdeen +1.3%, while Cotswold in the South West records +3.1%. The era of deeply negative London territory appears to be a short- to medium-term phenomenon rather than a structural one.
Conclusion
The overarching narrative this month is one of gradual rebalancing rather than crisis. Affordability remains the defining force reshaping the UK property market, with Northern Ireland, Wales, the North West and parts of the North East consistently leading across all time horizons, whilst London and pockets of the South continue to face a correction that is, encouragingly, beginning to moderate by the medium term. Nationally, the model points to a brief near-term pause before resuming its upward path to £305k by 2031. This pattern echoes last month’s post, and the consistency across model updates lends confidence to the underlying direction of travel — no boom, but no structural collapse either.
- UK House price prediction – April 2026
Economic summary
News
The UK economic backdrop has grown increasingly turbulent over the past month. Inflation, as measured by the Consumer Prices Index (CPI), rose to 3.3% in the 12 months to March 2026, up from 3.0% in February, driven largely by surging energy costs linked to the ongoing Middle East conflict. The Bank of England had expected inflation to fall to around 2% by spring 2026, but the war has disrupted global oil and gas supply, pushing prices higher than forecast, with markets and most economists expecting the Bank to hold interest rates at 3.75% at its 30 April meeting. Meanwhile, economic uncertainty has become the most-cited challenge for UK businesses, affecting 40% of trading firms with ten or more employees in early April, the highest proportion recorded since the question was first introduced in 2022.
Indicators
- Average house prices decreased very slightly to £268k on the previous month
- Mortgage rates for 75 % LTV and 95 % LTV have both jumped by nearly 50 basis points
Current growth rates
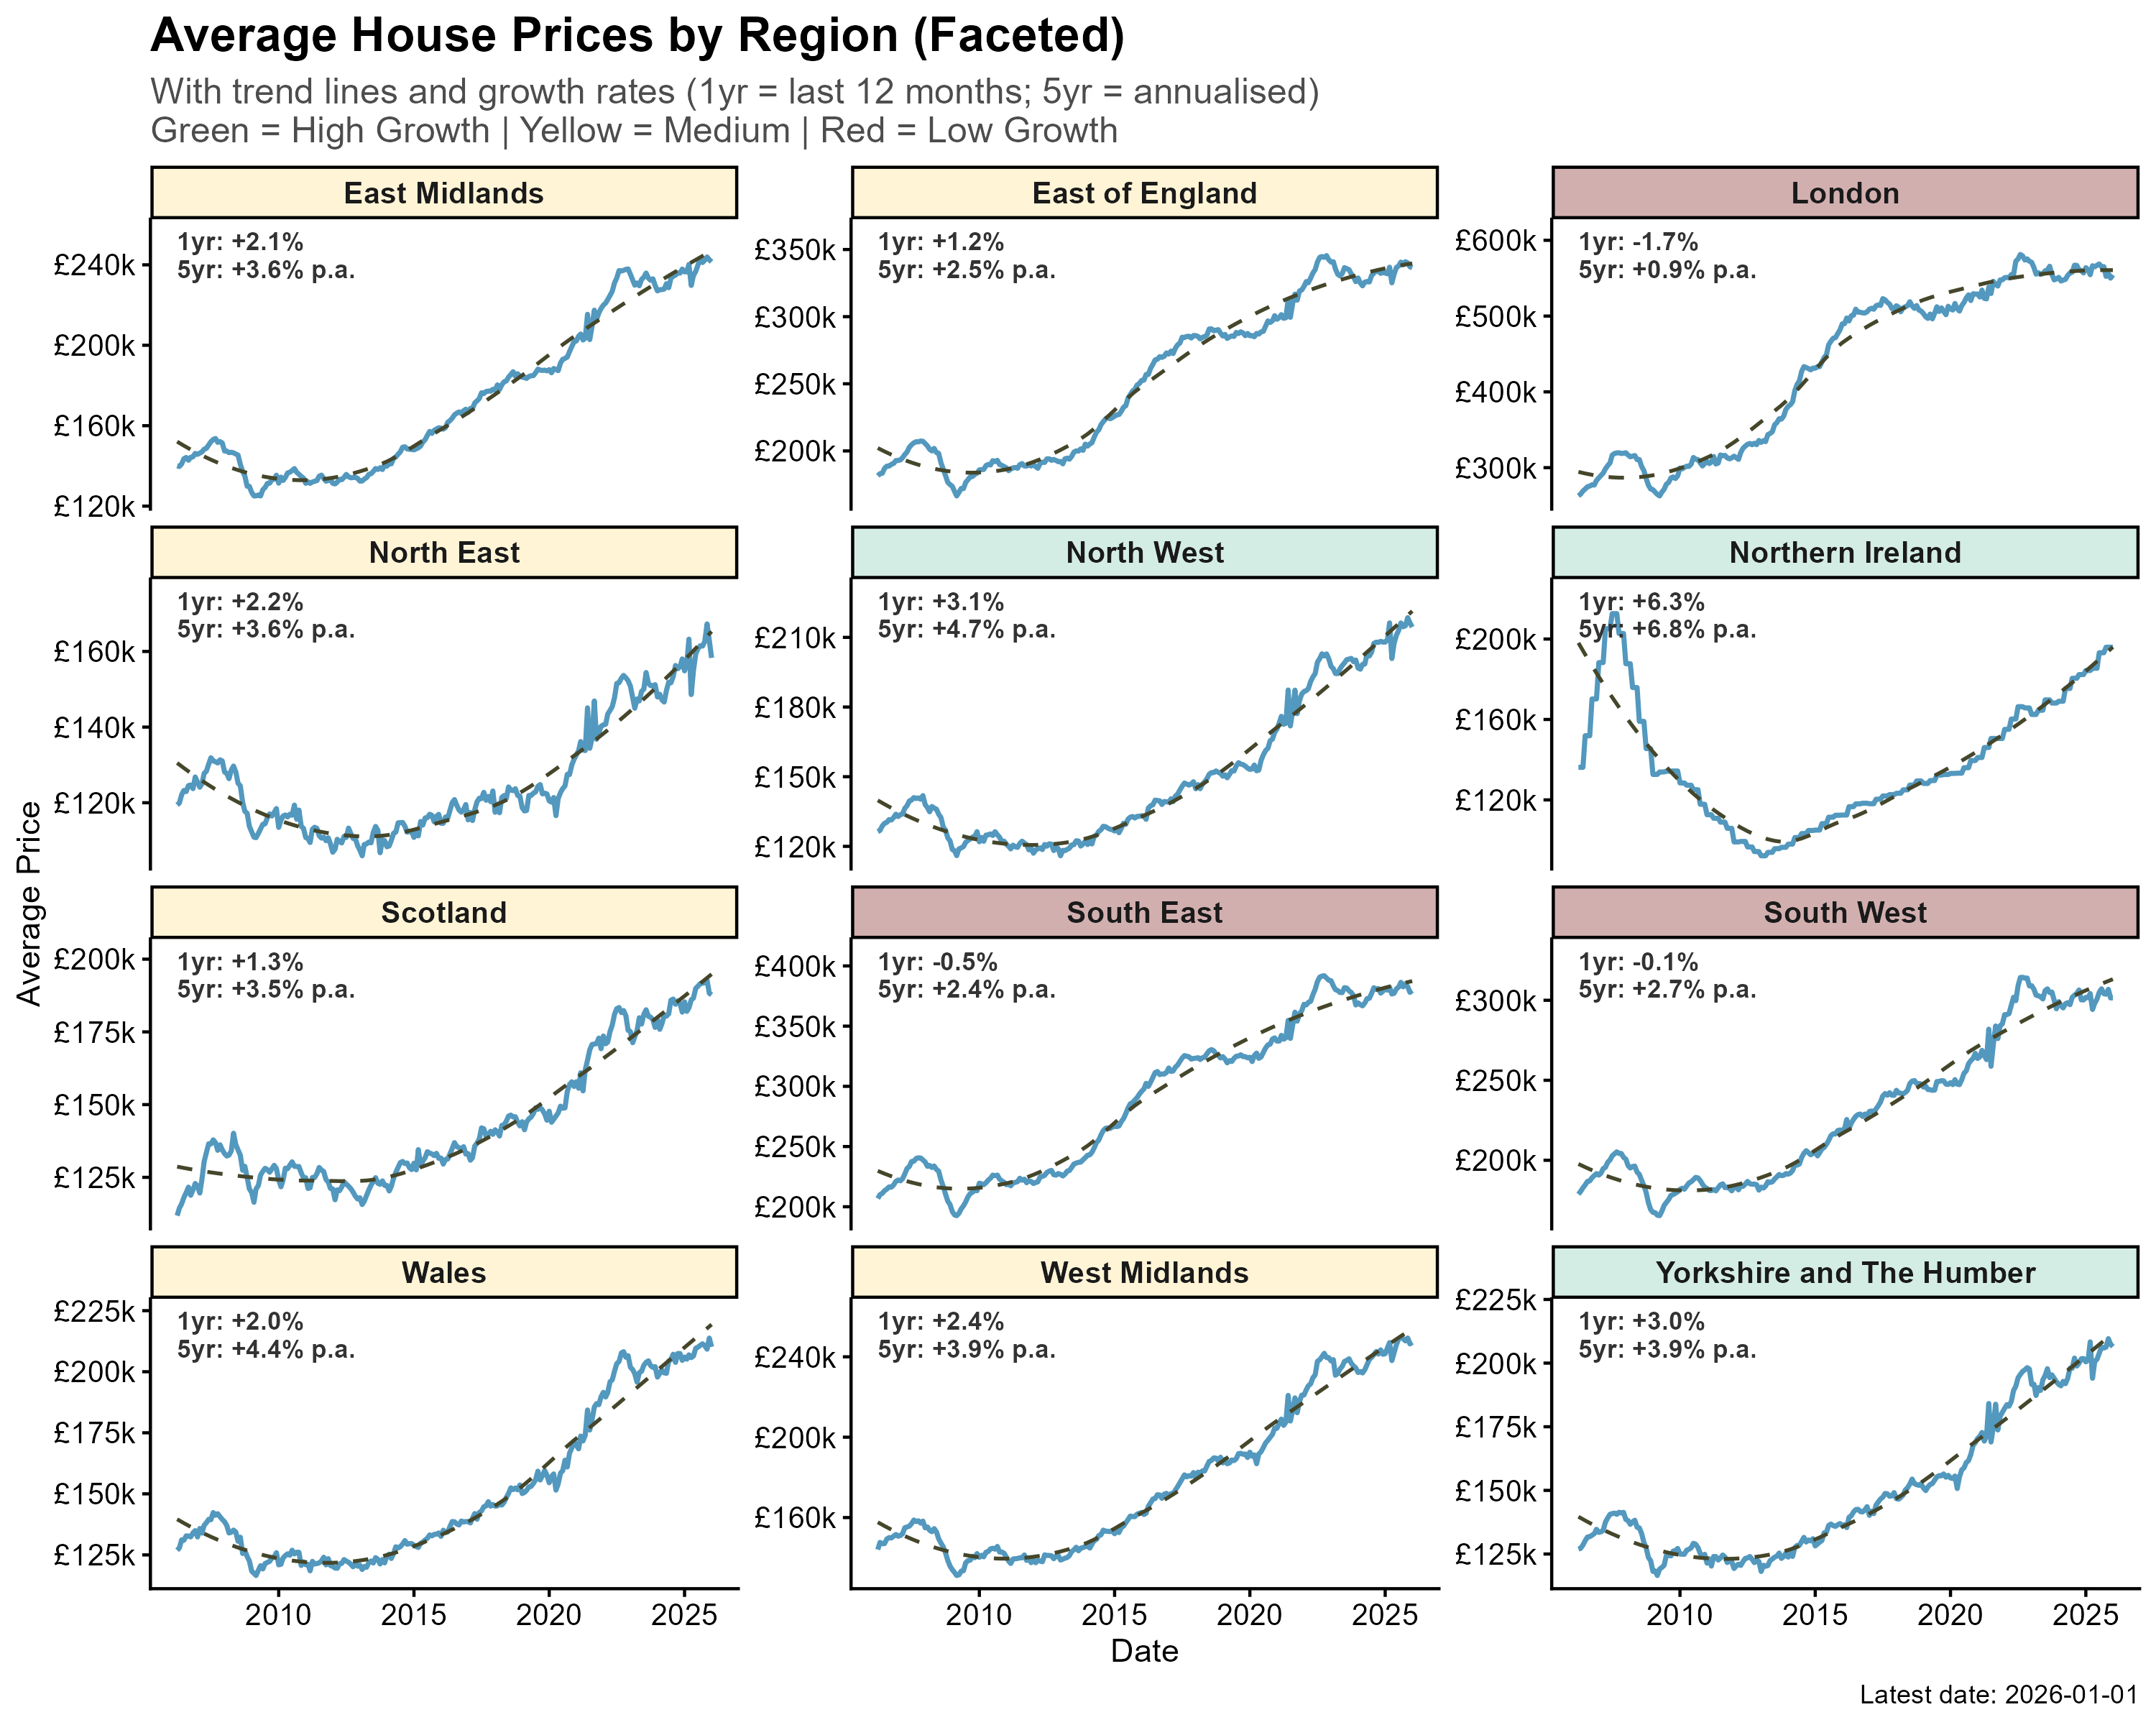
Regional house price performance continue to be strikingly divergent. Northern Ireland leads all regions with 1-year growth of +6.3% and a 5-year annualised rate of +6.8%, followed by the North East (+3.6%) and North West (+3.4%), suggesting momentum has firmly shifted towards more affordable northern markets. At the other end, London is the standout underperformer, down 3.3% over the past year and barely growing over five years (+0.6% p.a.), with the South East (-0.9%) and South West (-0.6%) also in negative territory annually. This north-south reversal reflects the continued affordability squeeze in higher-priced regions, where elevated mortgage rates are biting hardest.

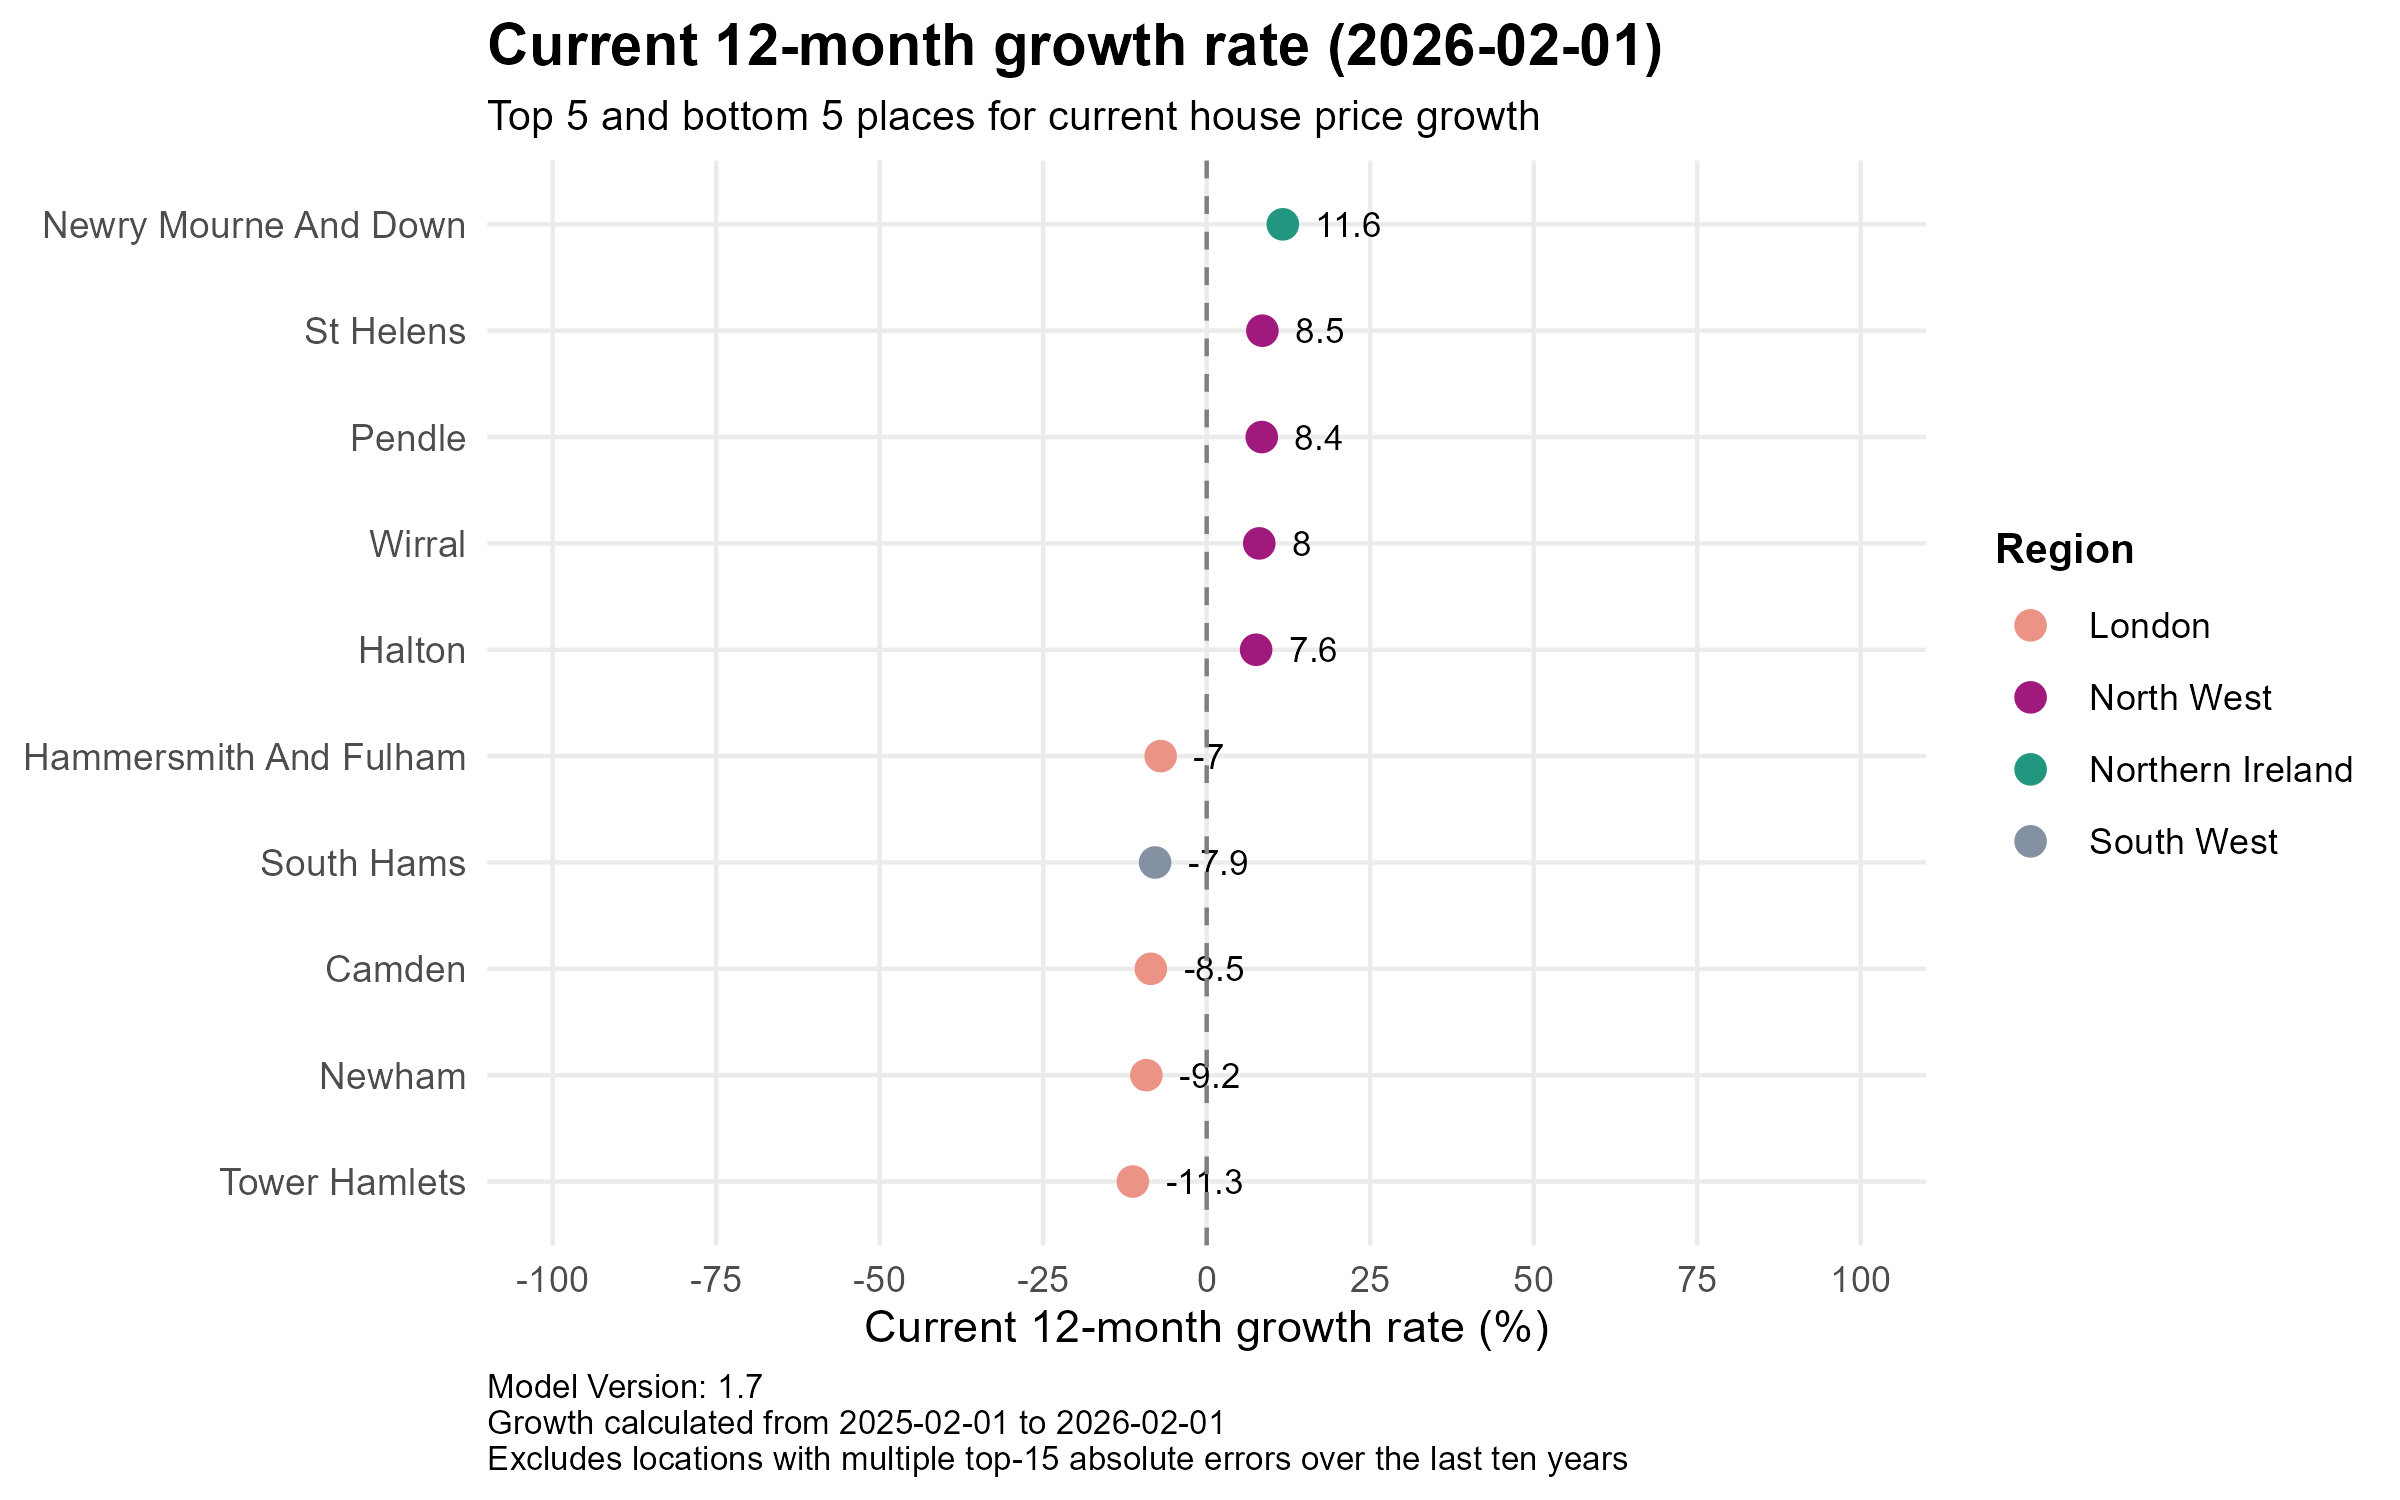
At the local level, the north-south divide is even more pronounced. Newry Mourne and Down leads the country with extraordinary growth of +11.6%, while four North West authorities: St Helens (+8.5%), Pendle (+8.4%), Wirral (+8.0%) and Halton (+7.6%) round out the top five, reflecting strong demand in relatively affordable Lancashire and Merseyside markets. The picture is starkly different in London, where Tower Hamlets (-11.3%), Newham (-9.2%) and Camden (-8.5%) are among the sharpest fallers nationally, joined by Hammersmith and Fulham (-7.0%) and South Hams (-7.9%) in Devon. The scale of these swings underlines just how unevenly mortgage rate pressures are being felt across the country.
Predictions
Overall
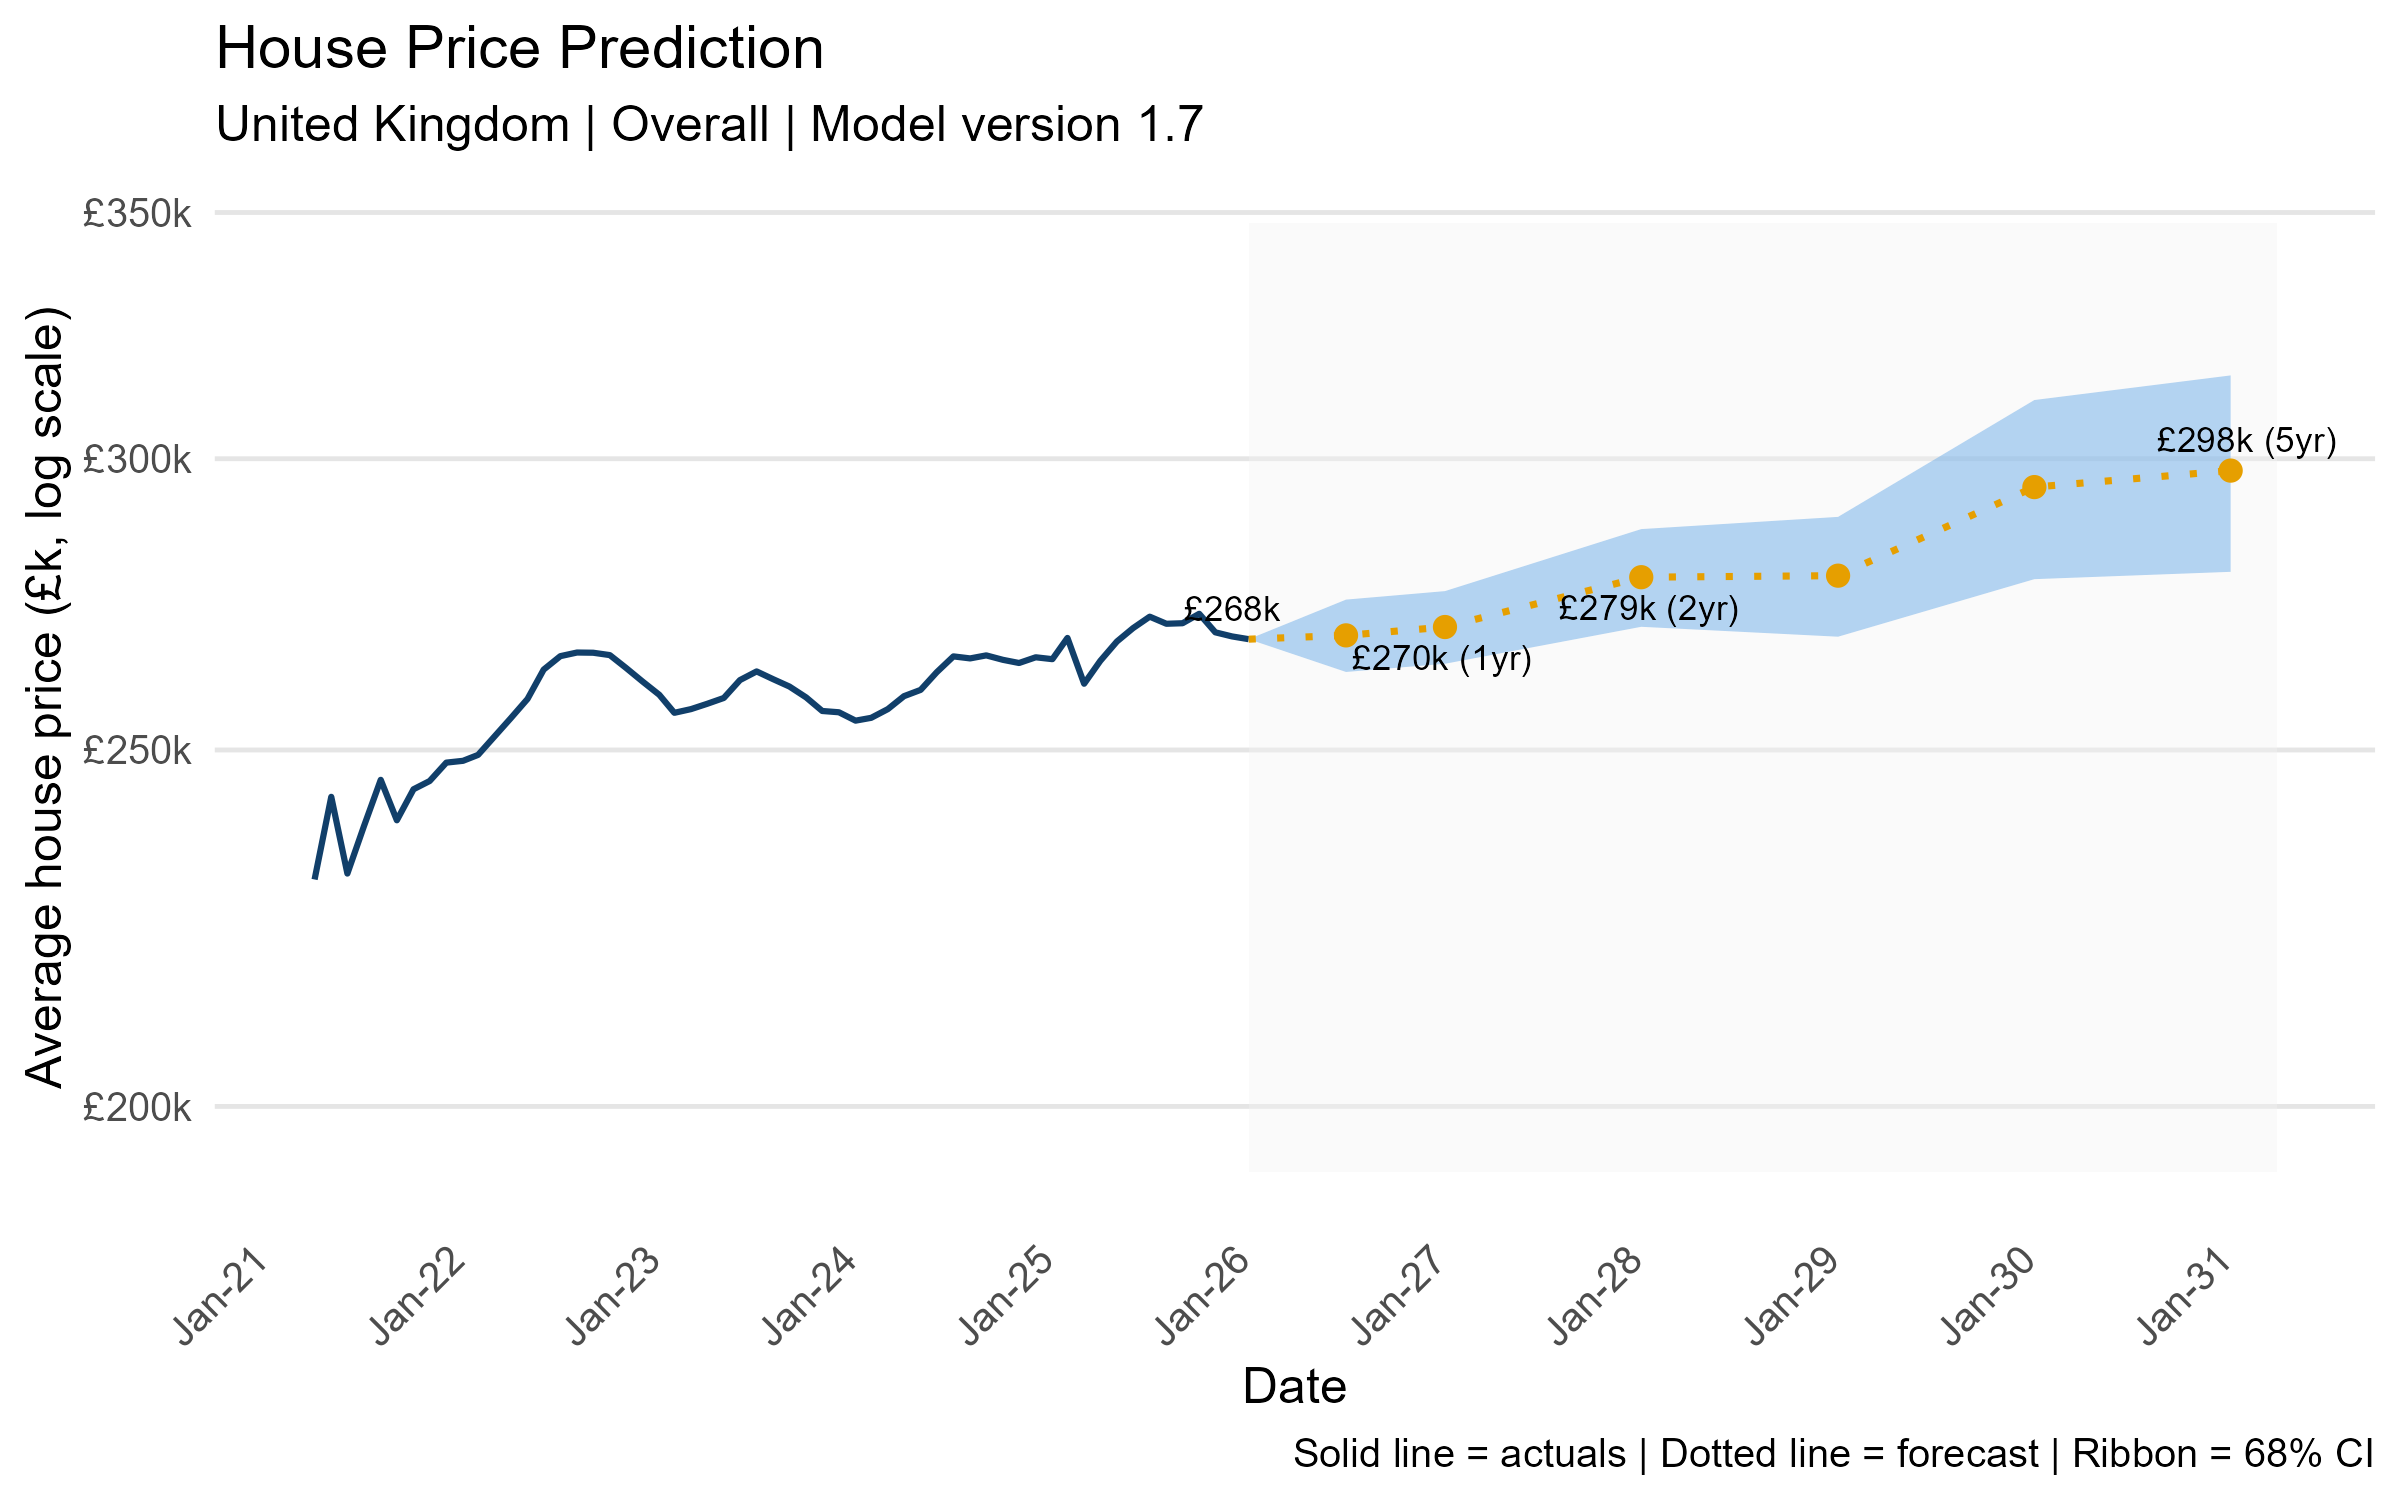
The model projects a gradual but steady recovery in UK average house prices from the current £268k, reaching £270k within a year, £279k by 2028, and approaching £298k by 2031.
Regional
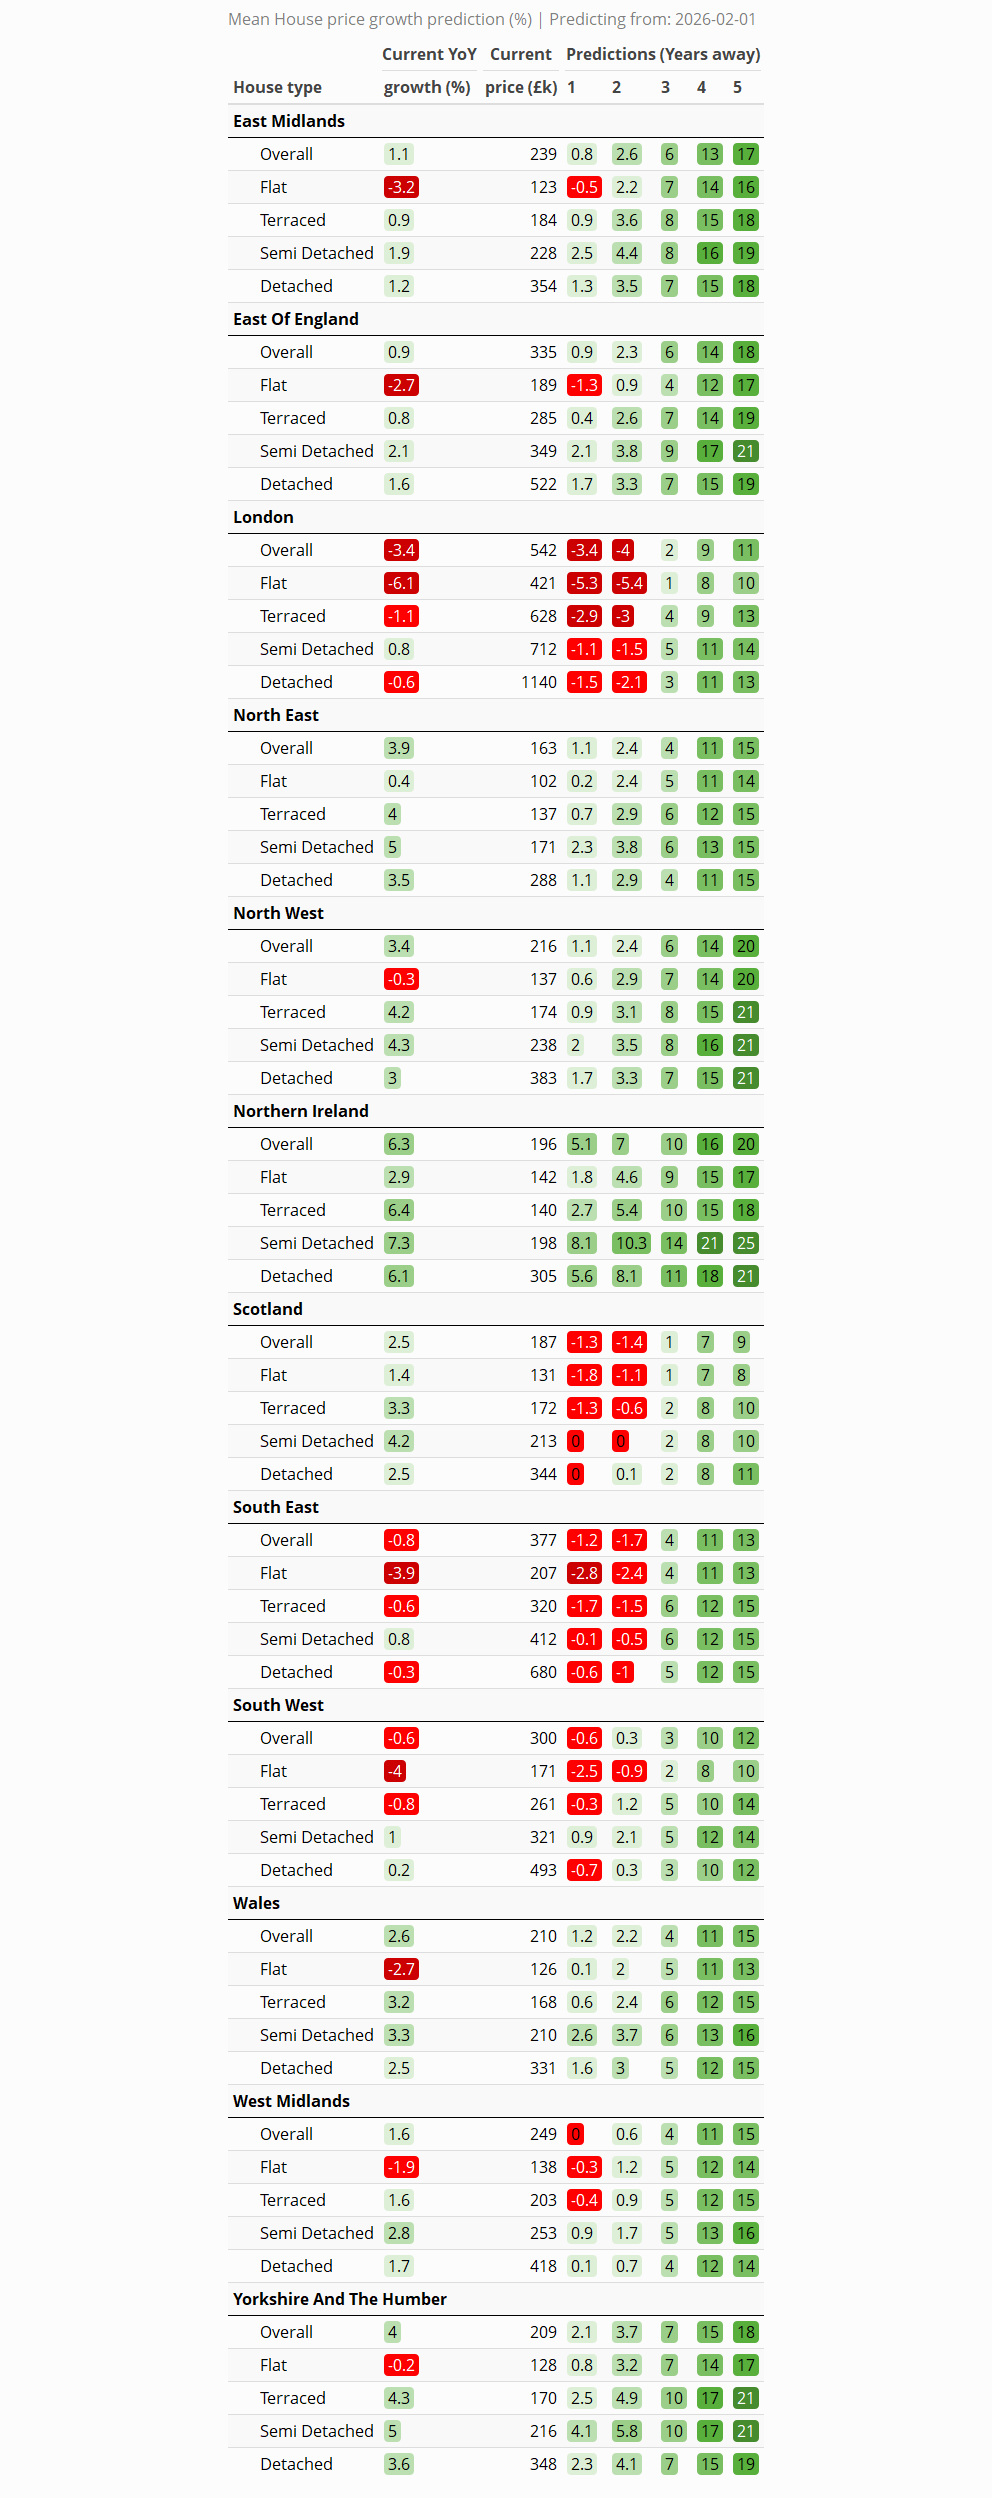
Short term (years 1–2): The near-term outlook is subdued for much of the country, with London facing the sharpest corrections. Overall prices forecast to fall a further 3–4% in year one before only a marginal recovery to -4% in year two, with flats particularly exposed at -5.3% and -5.4% respectively. Northern Ireland bucks the trend decisively, projecting 5.1% growth in year one and 7% in year two, while most other regions post modest gains of 1–2%, and Scotland dips slightly into negative territory before stabilising.
Medium term (years 3–4): By years three and four, the picture brightens meaningfully across almost all regions, with Northern Ireland continuing to lead — semi-detached properties there are forecast to grow 10.3% in year three and 14% in year four. London begins its slow rehabilitation, returning to positive territory at around 2–5% growth, though it remains the weakest of all regions; the North West, Yorkshire, and the North East all forecast solid mid-single-digit gains, reflecting the continued repricing of affordable northern markets.
Long term (year 5): The five-year view is broadly optimistic, with most regions projecting cumulative growth in the 11–21% range. Northern Ireland again leads at up to 25% for semi-detached homes, and Yorkshire, the North West and the North East all forecast around 15–21%. London recovers to 9–14% by year five depending on property type, a meaningful improvement but still lagging the national picture, reinforcing the structural shift in demand away from the capital that has characterised this cycle.
Local
12-month prediction (to February 2027)
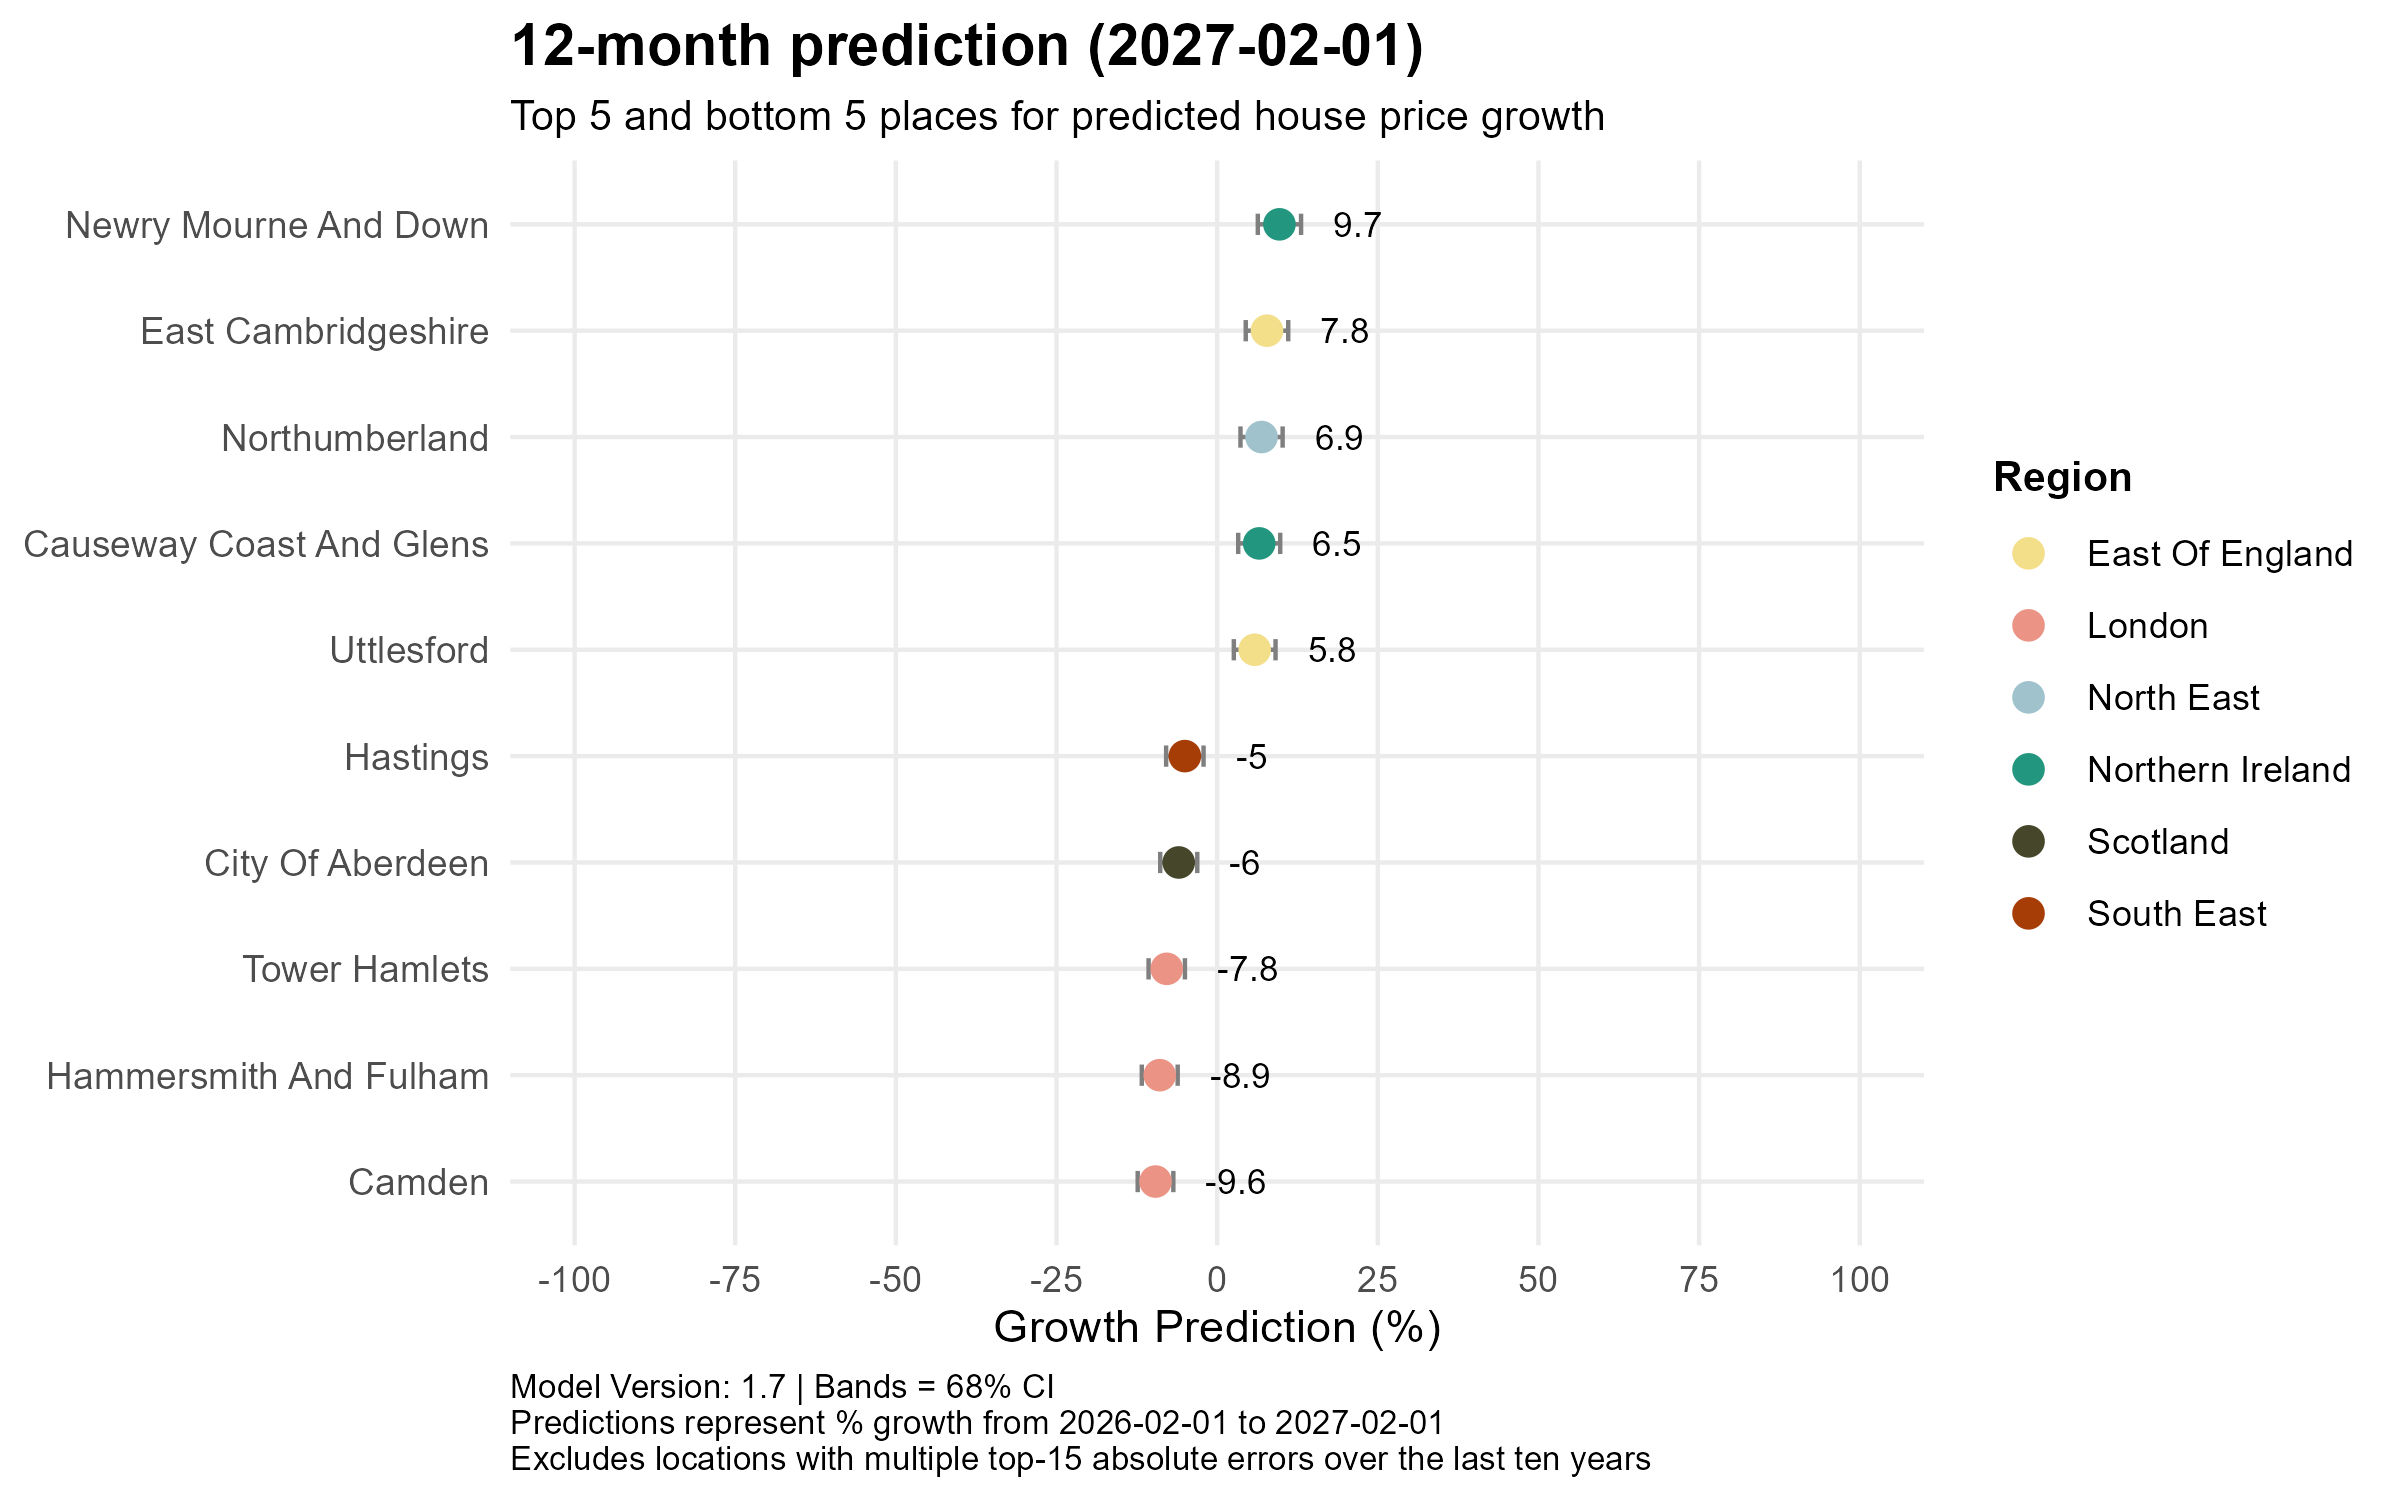
Northern Ireland dominates the top performers, with Newry Mourne and Down leading at +9.7%, joined by Causeway Coast and Glens (+6.5%), while East Cambridgeshire (+7.8%) and Uttlesford (+5.8%), both in the East of England and Northumberland (+6.9%) in the North East also feature strongly. London bears the brunt of the short-term pain, with Camden (-9.6%), Hammersmith and Fulham (-8.9%) and Tower Hamlets (-7.8%) all forecast to fall sharply. Hastings in the South East (-5.0%) and City of Aberdeen (-6.0%) round out the bottom five, suggesting weakness is not confined to the capital alone.
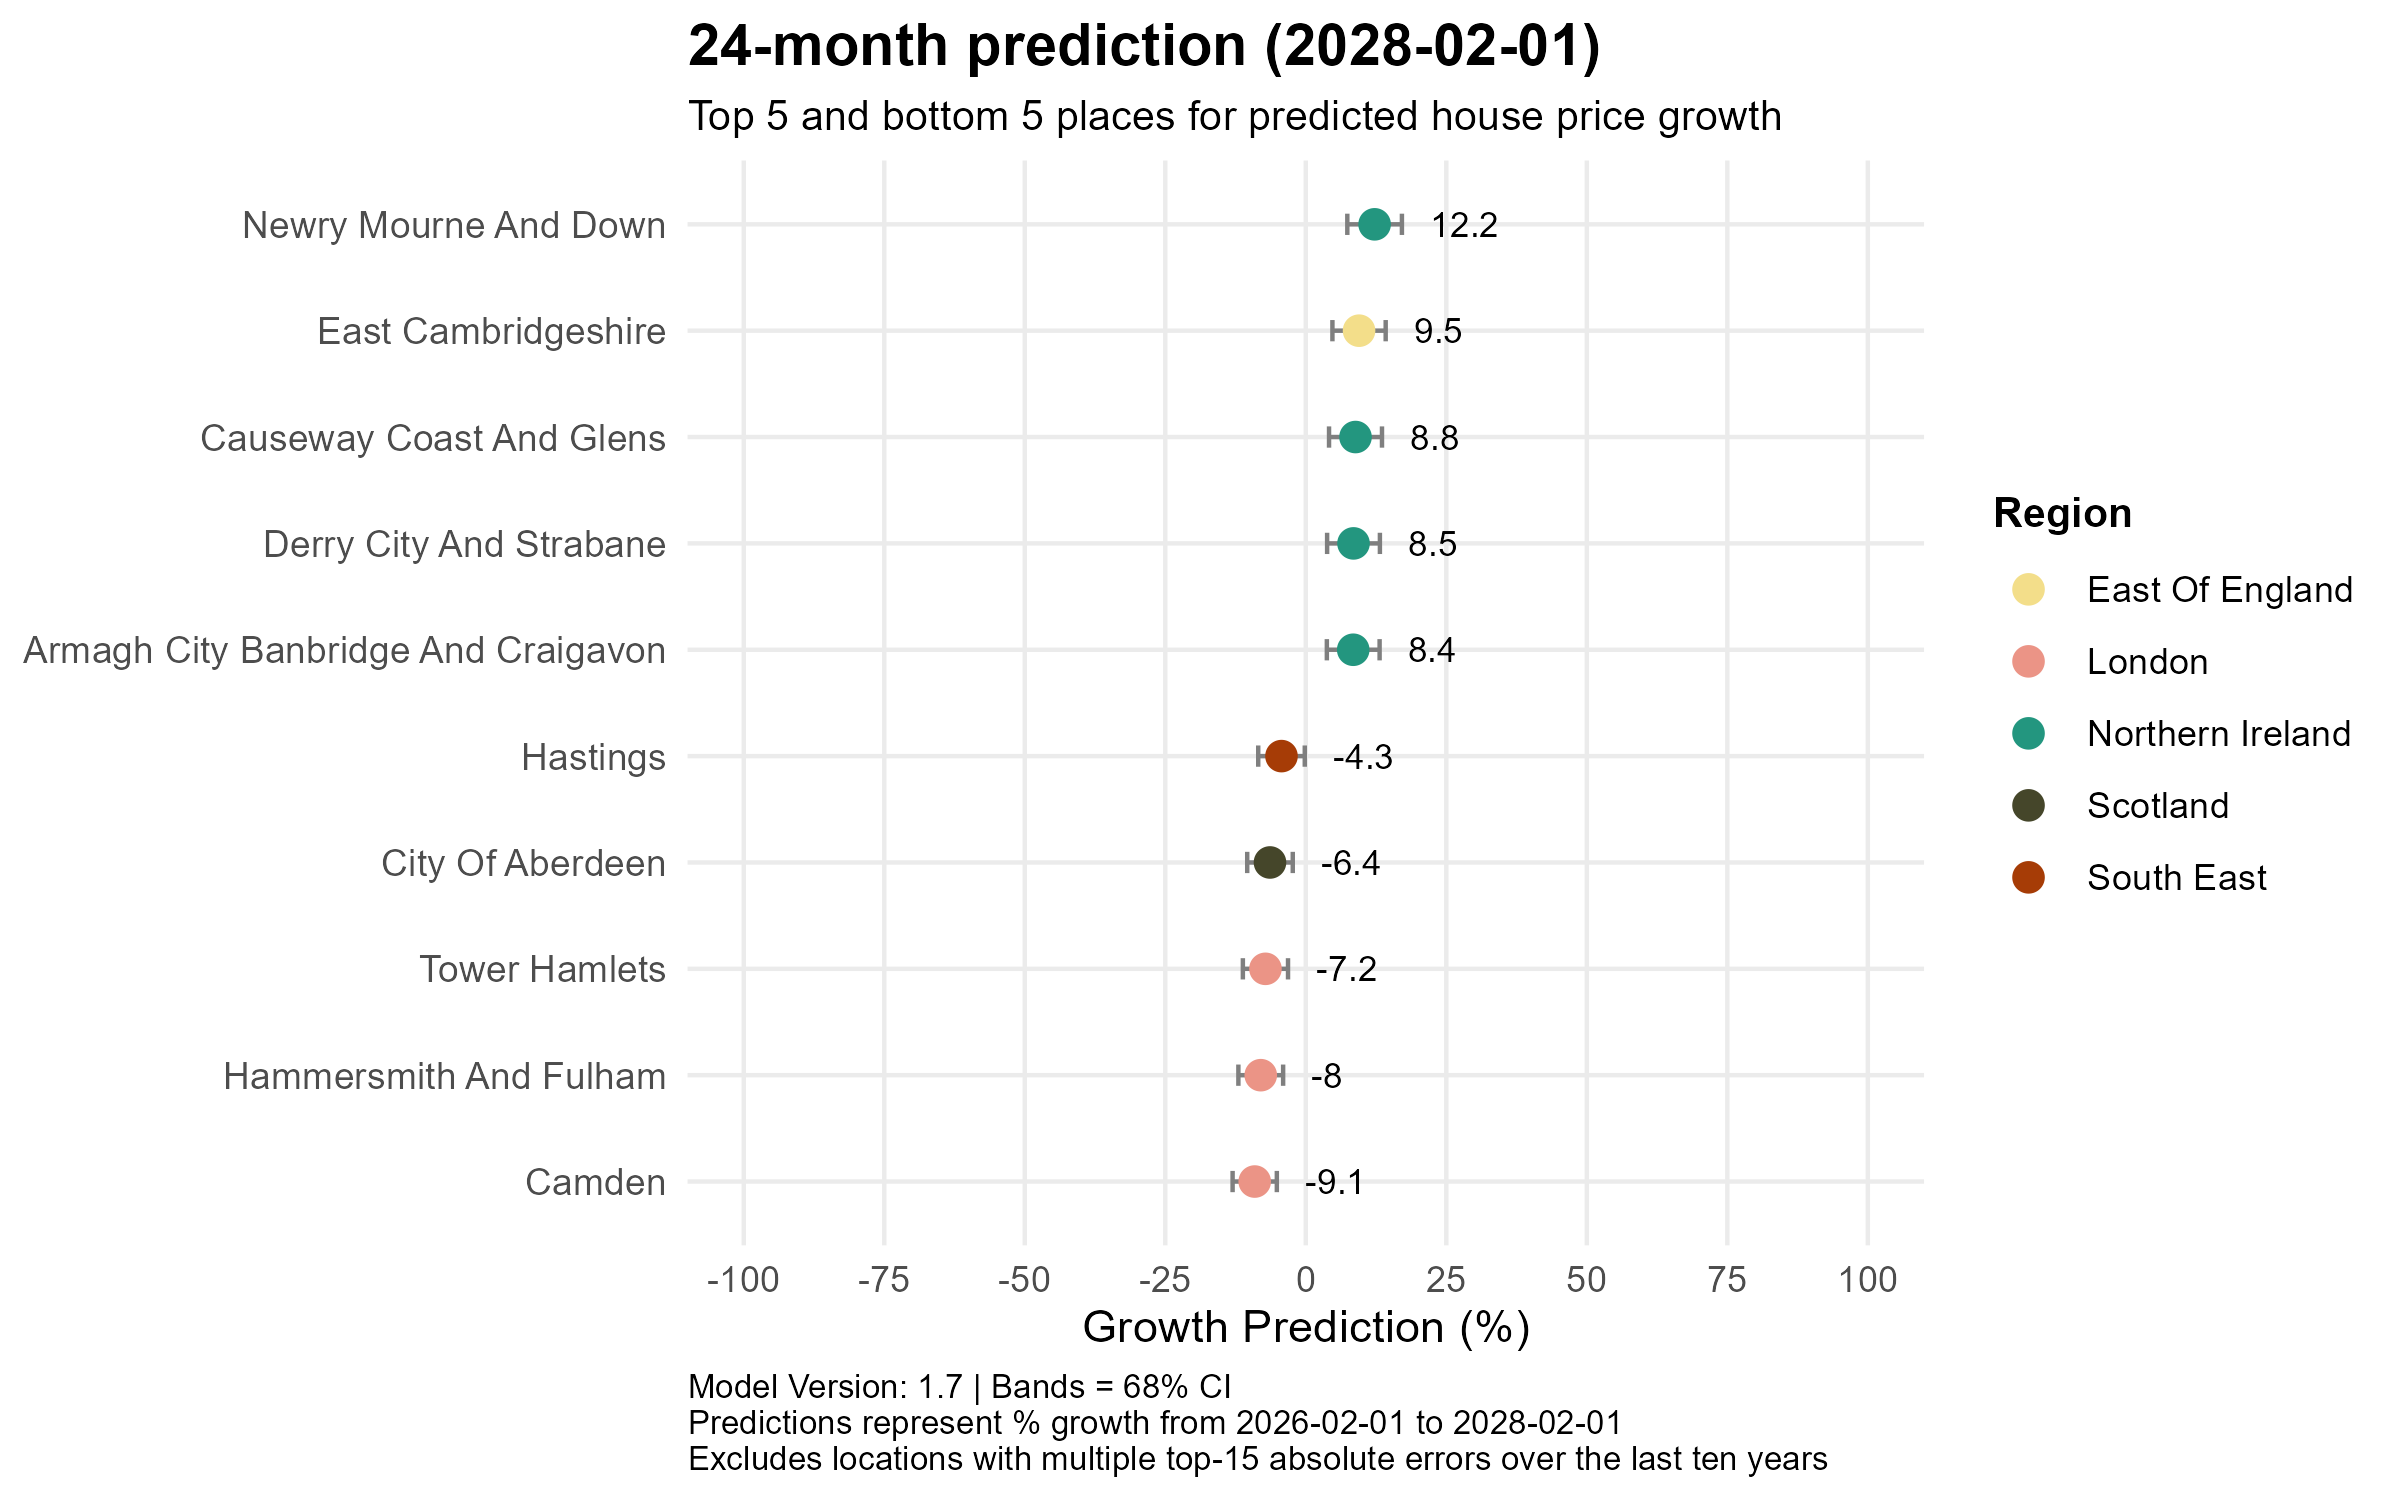
24-month prediction (to February 2028)
By 2028, Northern Ireland’s dominance intensifies, Newry Mourne and Down extends its lead to +12.2%, and three further Northern Ireland authorities enter the top five: Causeway Coast and Glens (+8.8%), Derry City and Strabane (+8.5%) and Armagh City Banbridge and Craigavon (+8.4%), with East Cambridgeshire (+9.5%) the sole non-Northern Ireland entry. The same London boroughs persist at the bottom Camden (-9.1%), Hammersmith and Fulham (-8.0%) and Tower Hamlets (-7.2%), alongside City of Aberdeen (-6.4%) and Hastings (-4.3%), though the losses are beginning to moderate slightly compared to the 12-month view.
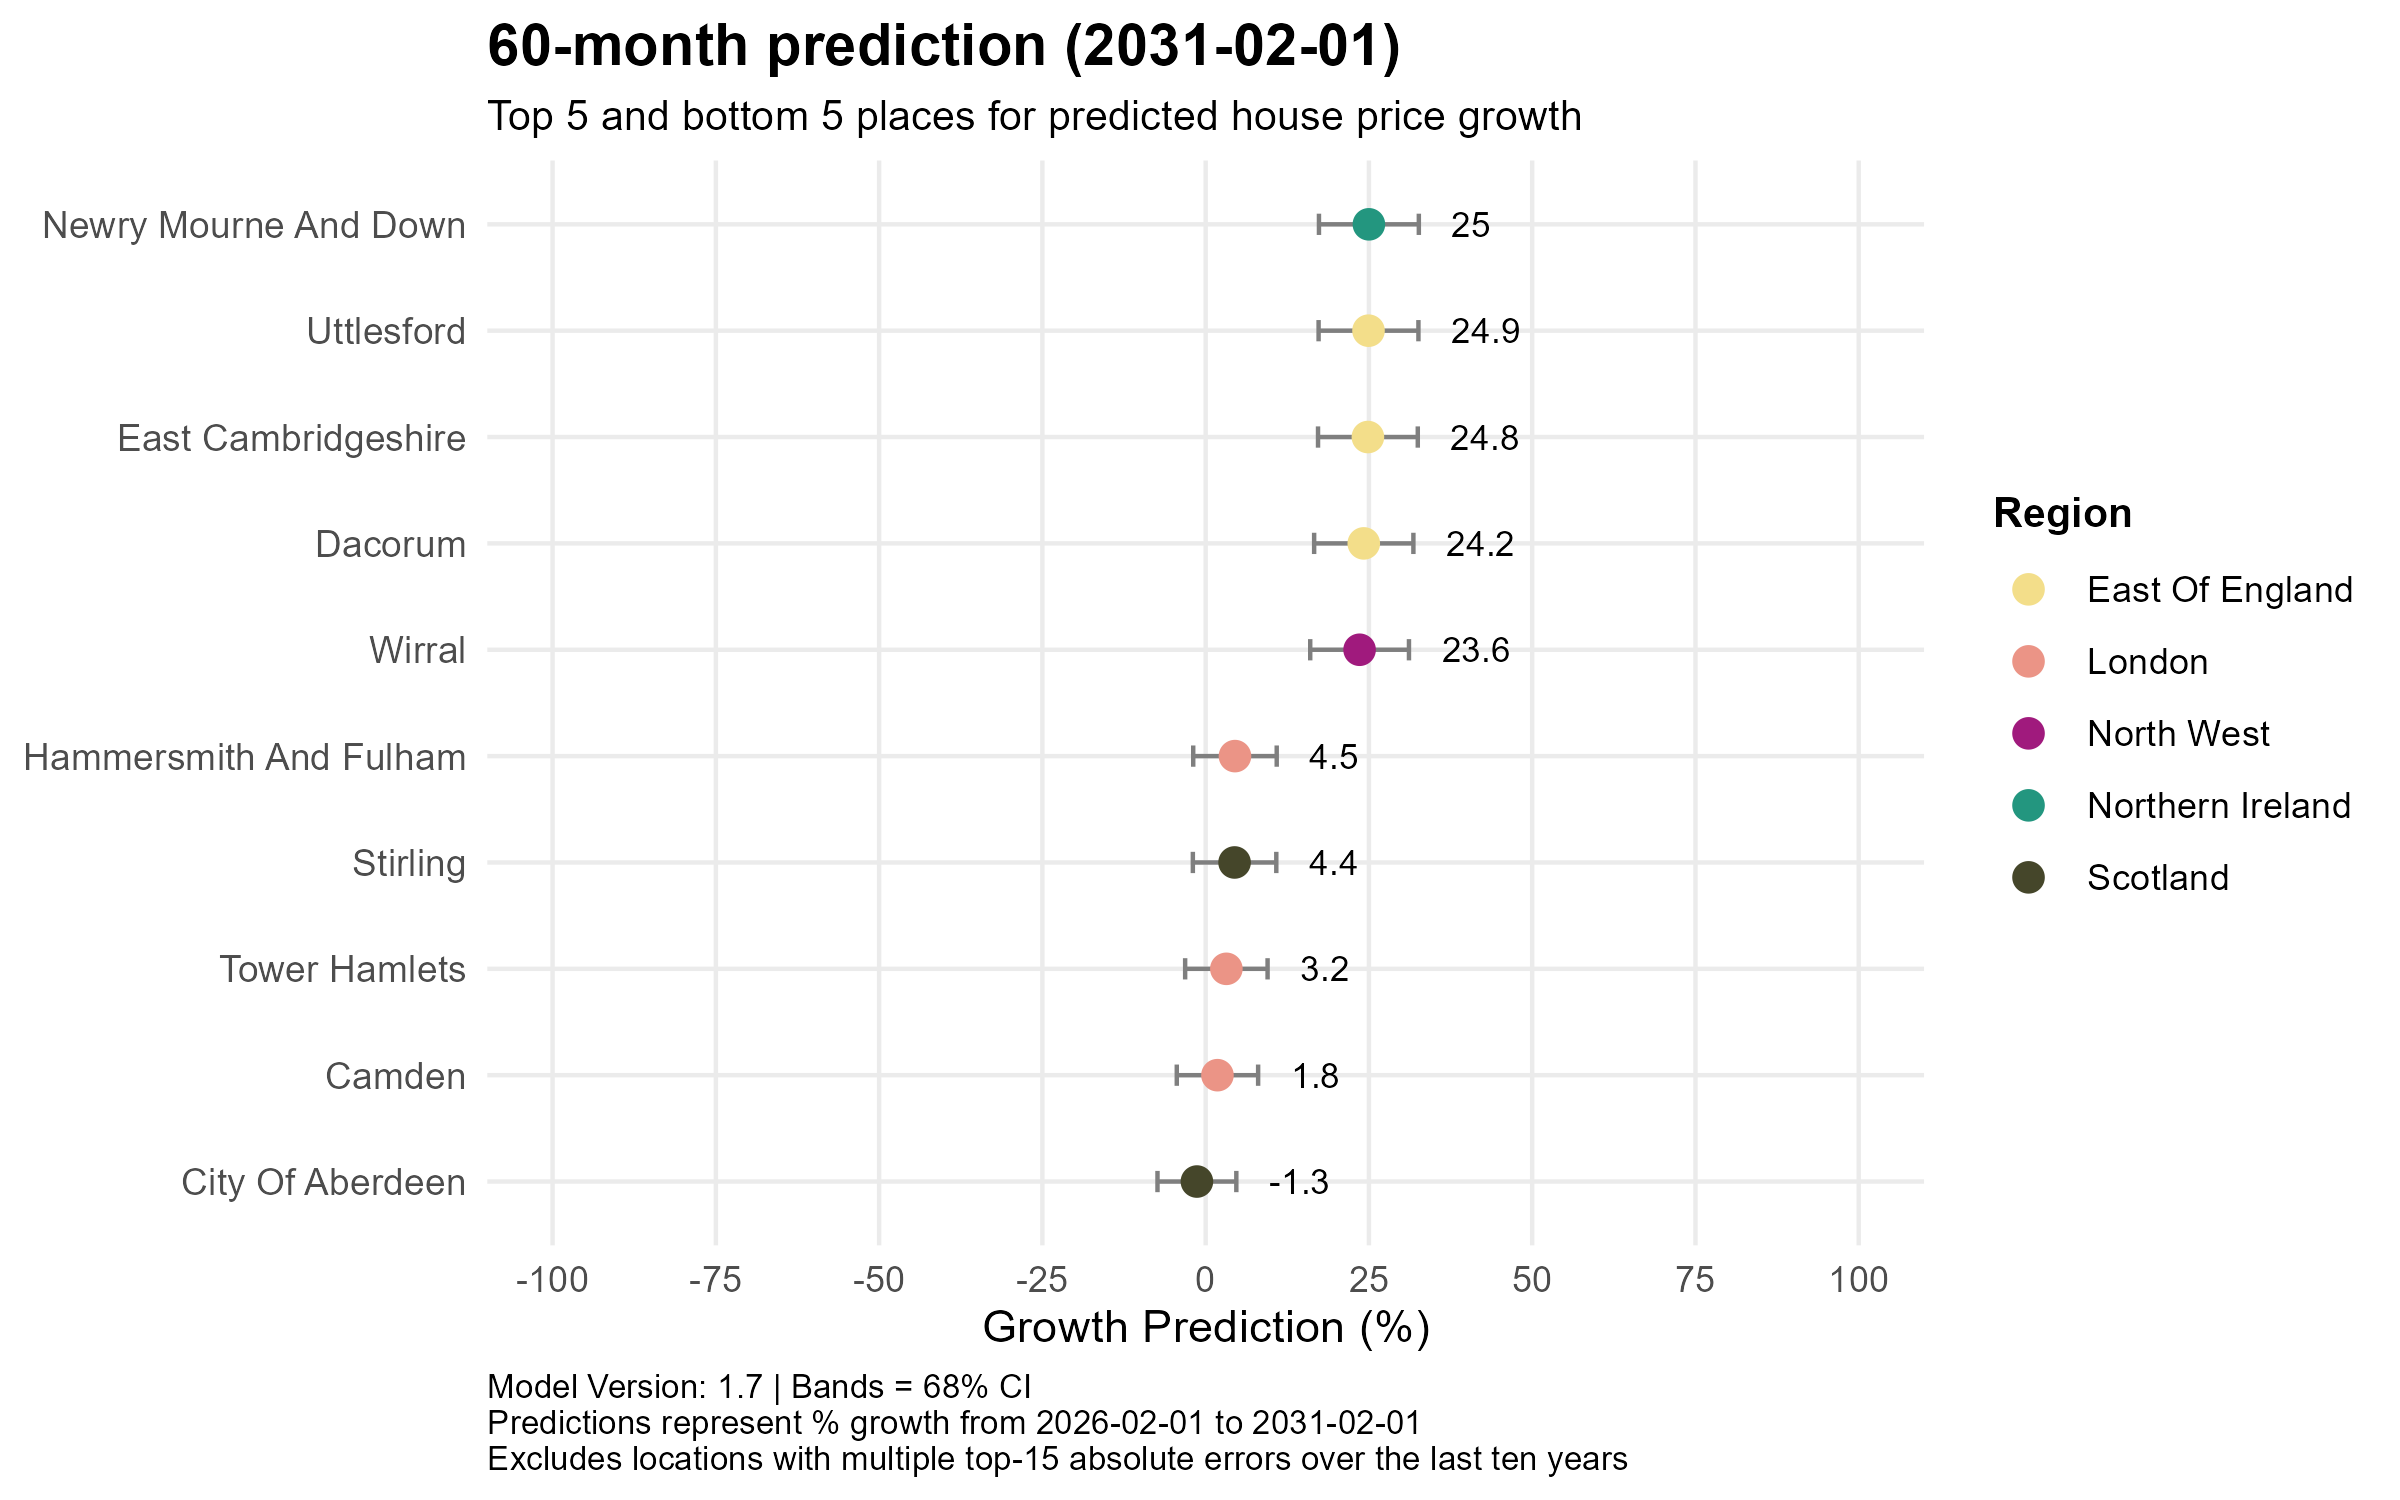
60-month prediction (to January 2031)
The five-year picture brings a dramatic rebalancing. London’s worst performers are no longer in deeply negative territory, with Camden (+1.8%), Tower Hamlets (+3.2%) and Hammersmith and Fulham (+4.5%) all recovering to modest positive growth, though they remain the laggards nationally. Newry Mourne and Down tops the leaderboard at +25%, closely followed by three East of England authorities. Uttlesford (+24.9%), East Cambridgeshire (+24.8%) and Dacorum (+24.2%) and Wirral in the North West (+23.6%), suggesting that affordable commuter and lifestyle markets are forecast to deliver the strongest long-run returns. City of Aberdeen is the sole location still in negative territory at -1.3%, reflecting structural challenges in Scotland’s oil-dependent north-east economy.
Conclusion
The overarching narrative across all time horizons is one of rebalancing rather than collapse. Affordability remains the defining force reshaping the UK property market, with Northern Ireland, the North West and parts of the North East consistently outperforming, whilst London faces a prolonged, though ultimately temporary correction. This pattern has been building for some months; with last months post also echoing the same statements. Nationally, the model points to modest but steady price growth towards £298k by 2031 — no boom, but no crash either.
- UK House price prediction – March 2026
Economic summary
News
The UK economy has entered 2026 on fragile footing, with the British Chambers of Commerce revising its GDP growth forecast down to just 1.0% for the year amid weak productivity, subdued investment and cautious consumer spending. Inflation held at 3% in February, but economists warn this figure does not yet reflect recent energy price increases, with some forecasts suggesting it could exceed 4–5% later in the year, driven largely by the ongoing Middle East conflict disrupting global energy markets.
Unemployment is expected to rise to 5.5% in 2026, while the Bank of England’s agents report a lacklustre economy, with employment intentions slightly negative and businesses continuing to report squeezed profit margins. Consumer confidence has fallen sharply to its lowest level in more than two years, casting a shadow over household finances and the broader property market
Indicators
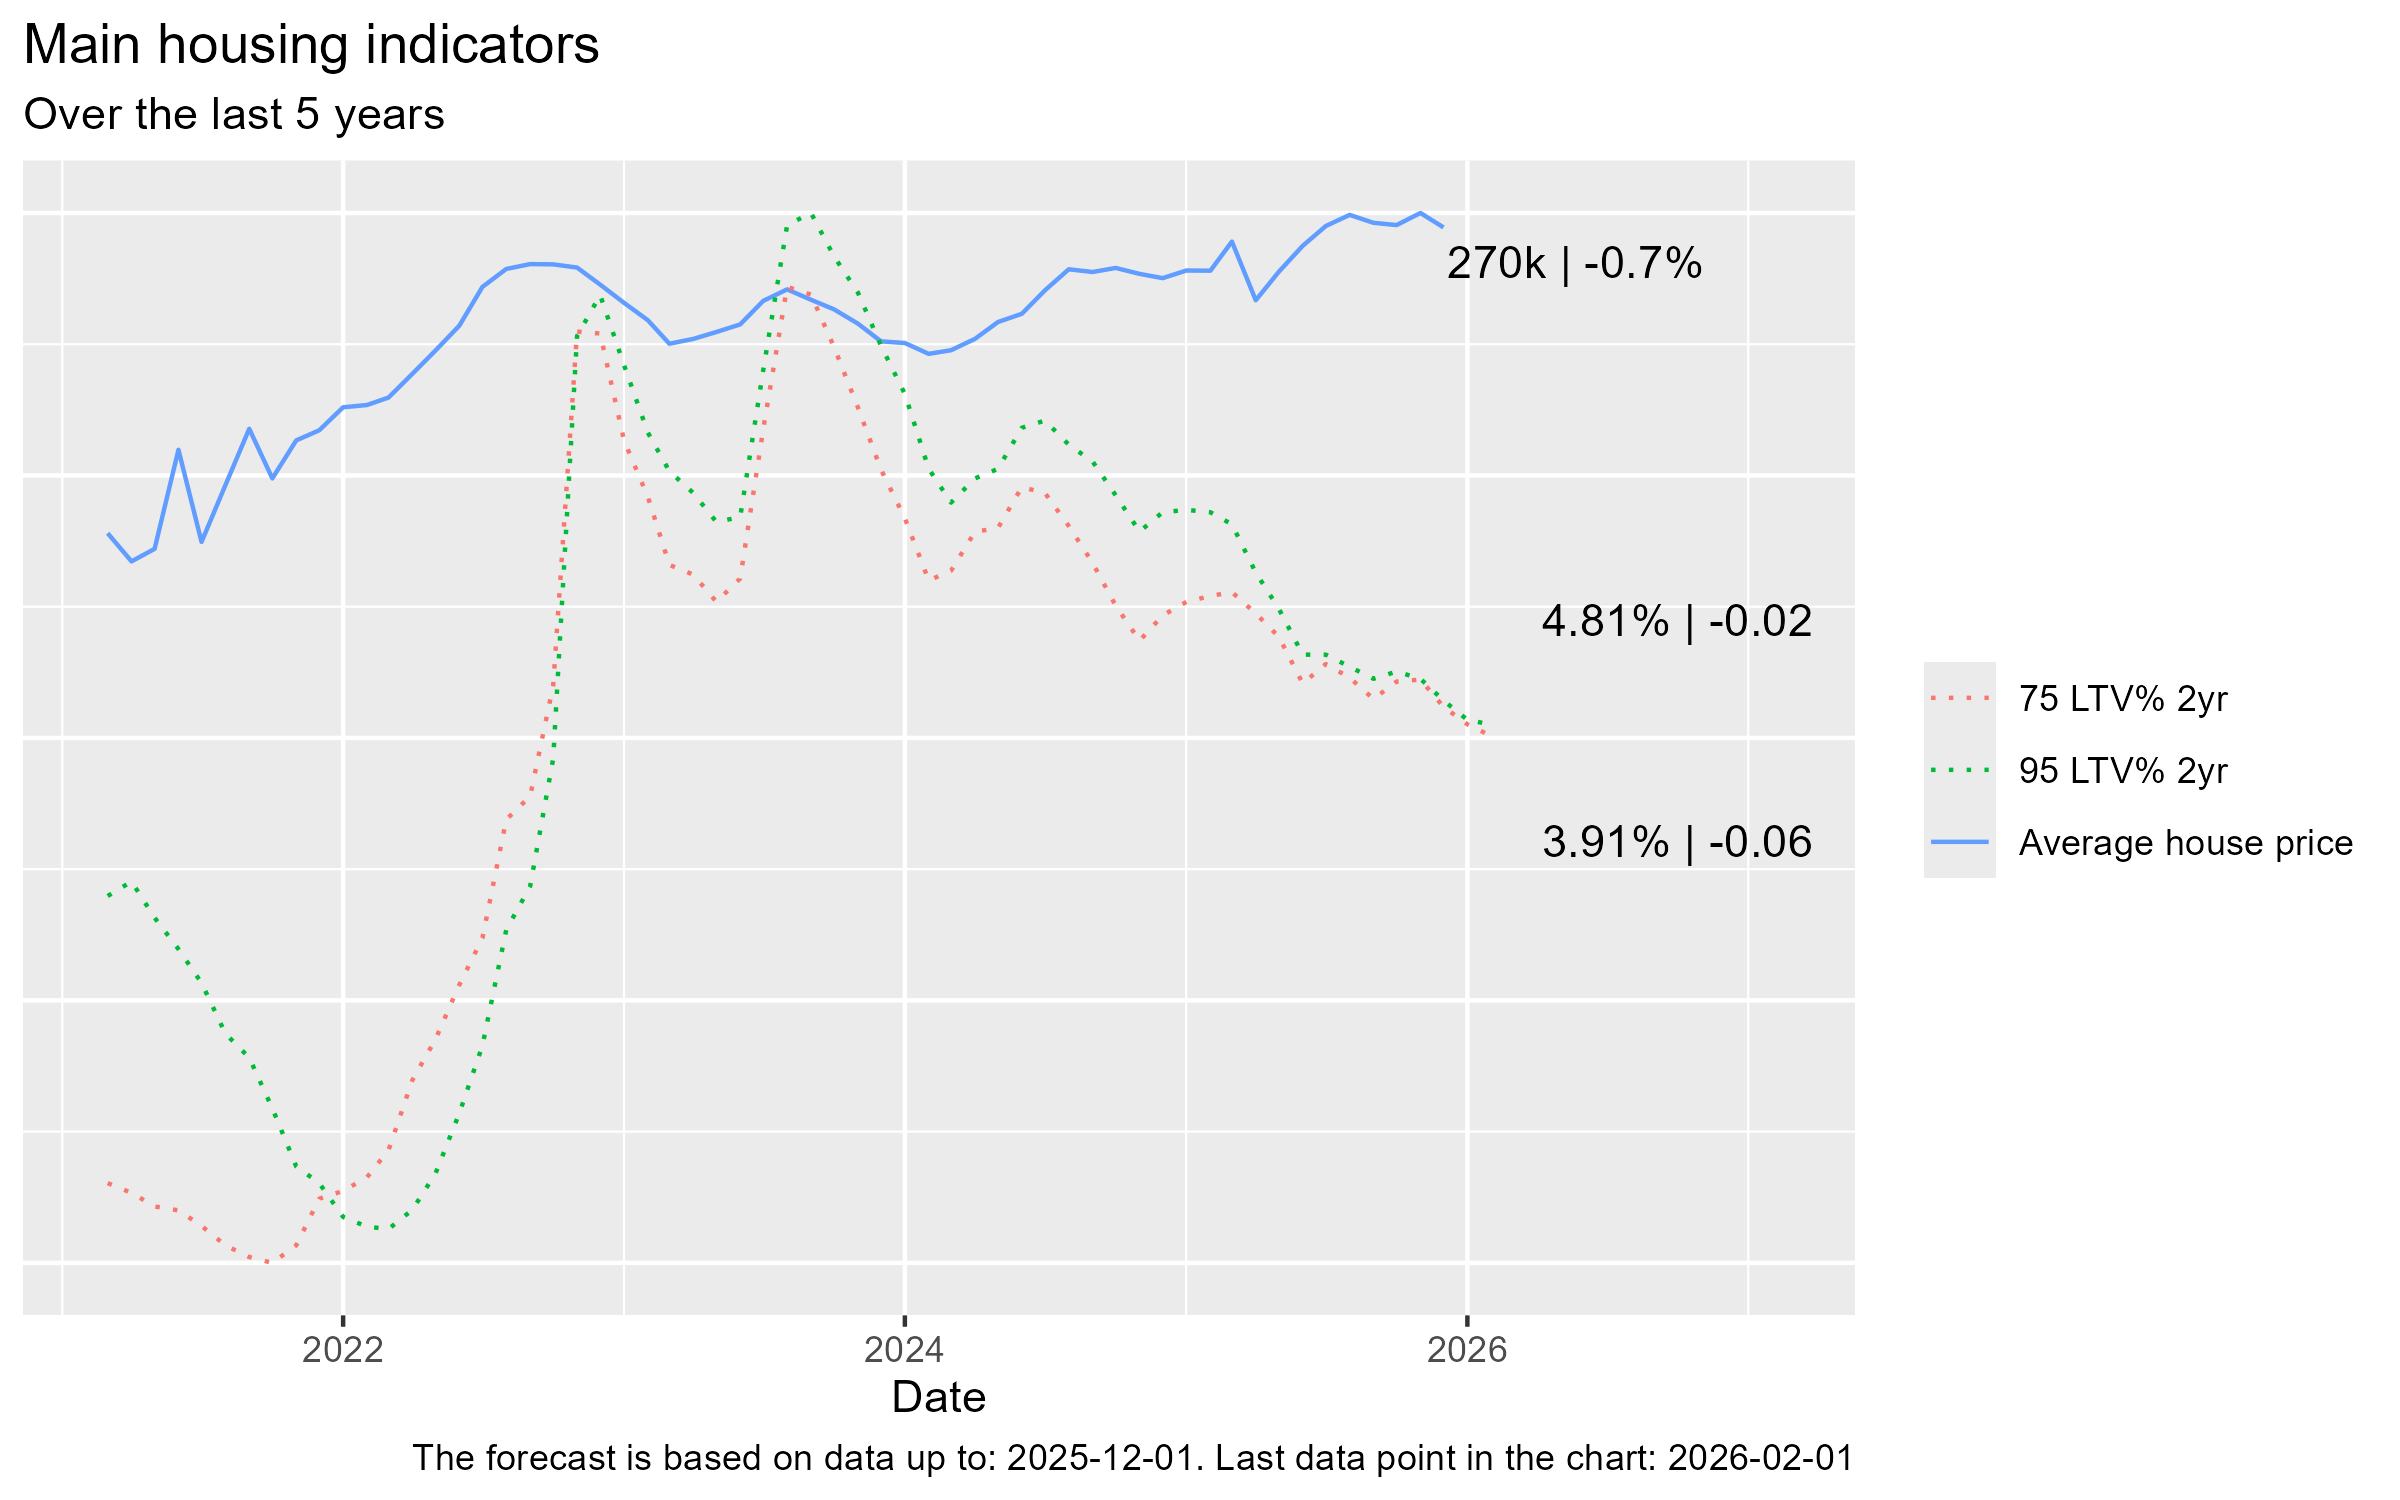
- Average house prices decreased very slightly to £268k on the previous month
- Mortgage rates for 75 % LTV and 95 % LTV have both ticked up
Current growth rates
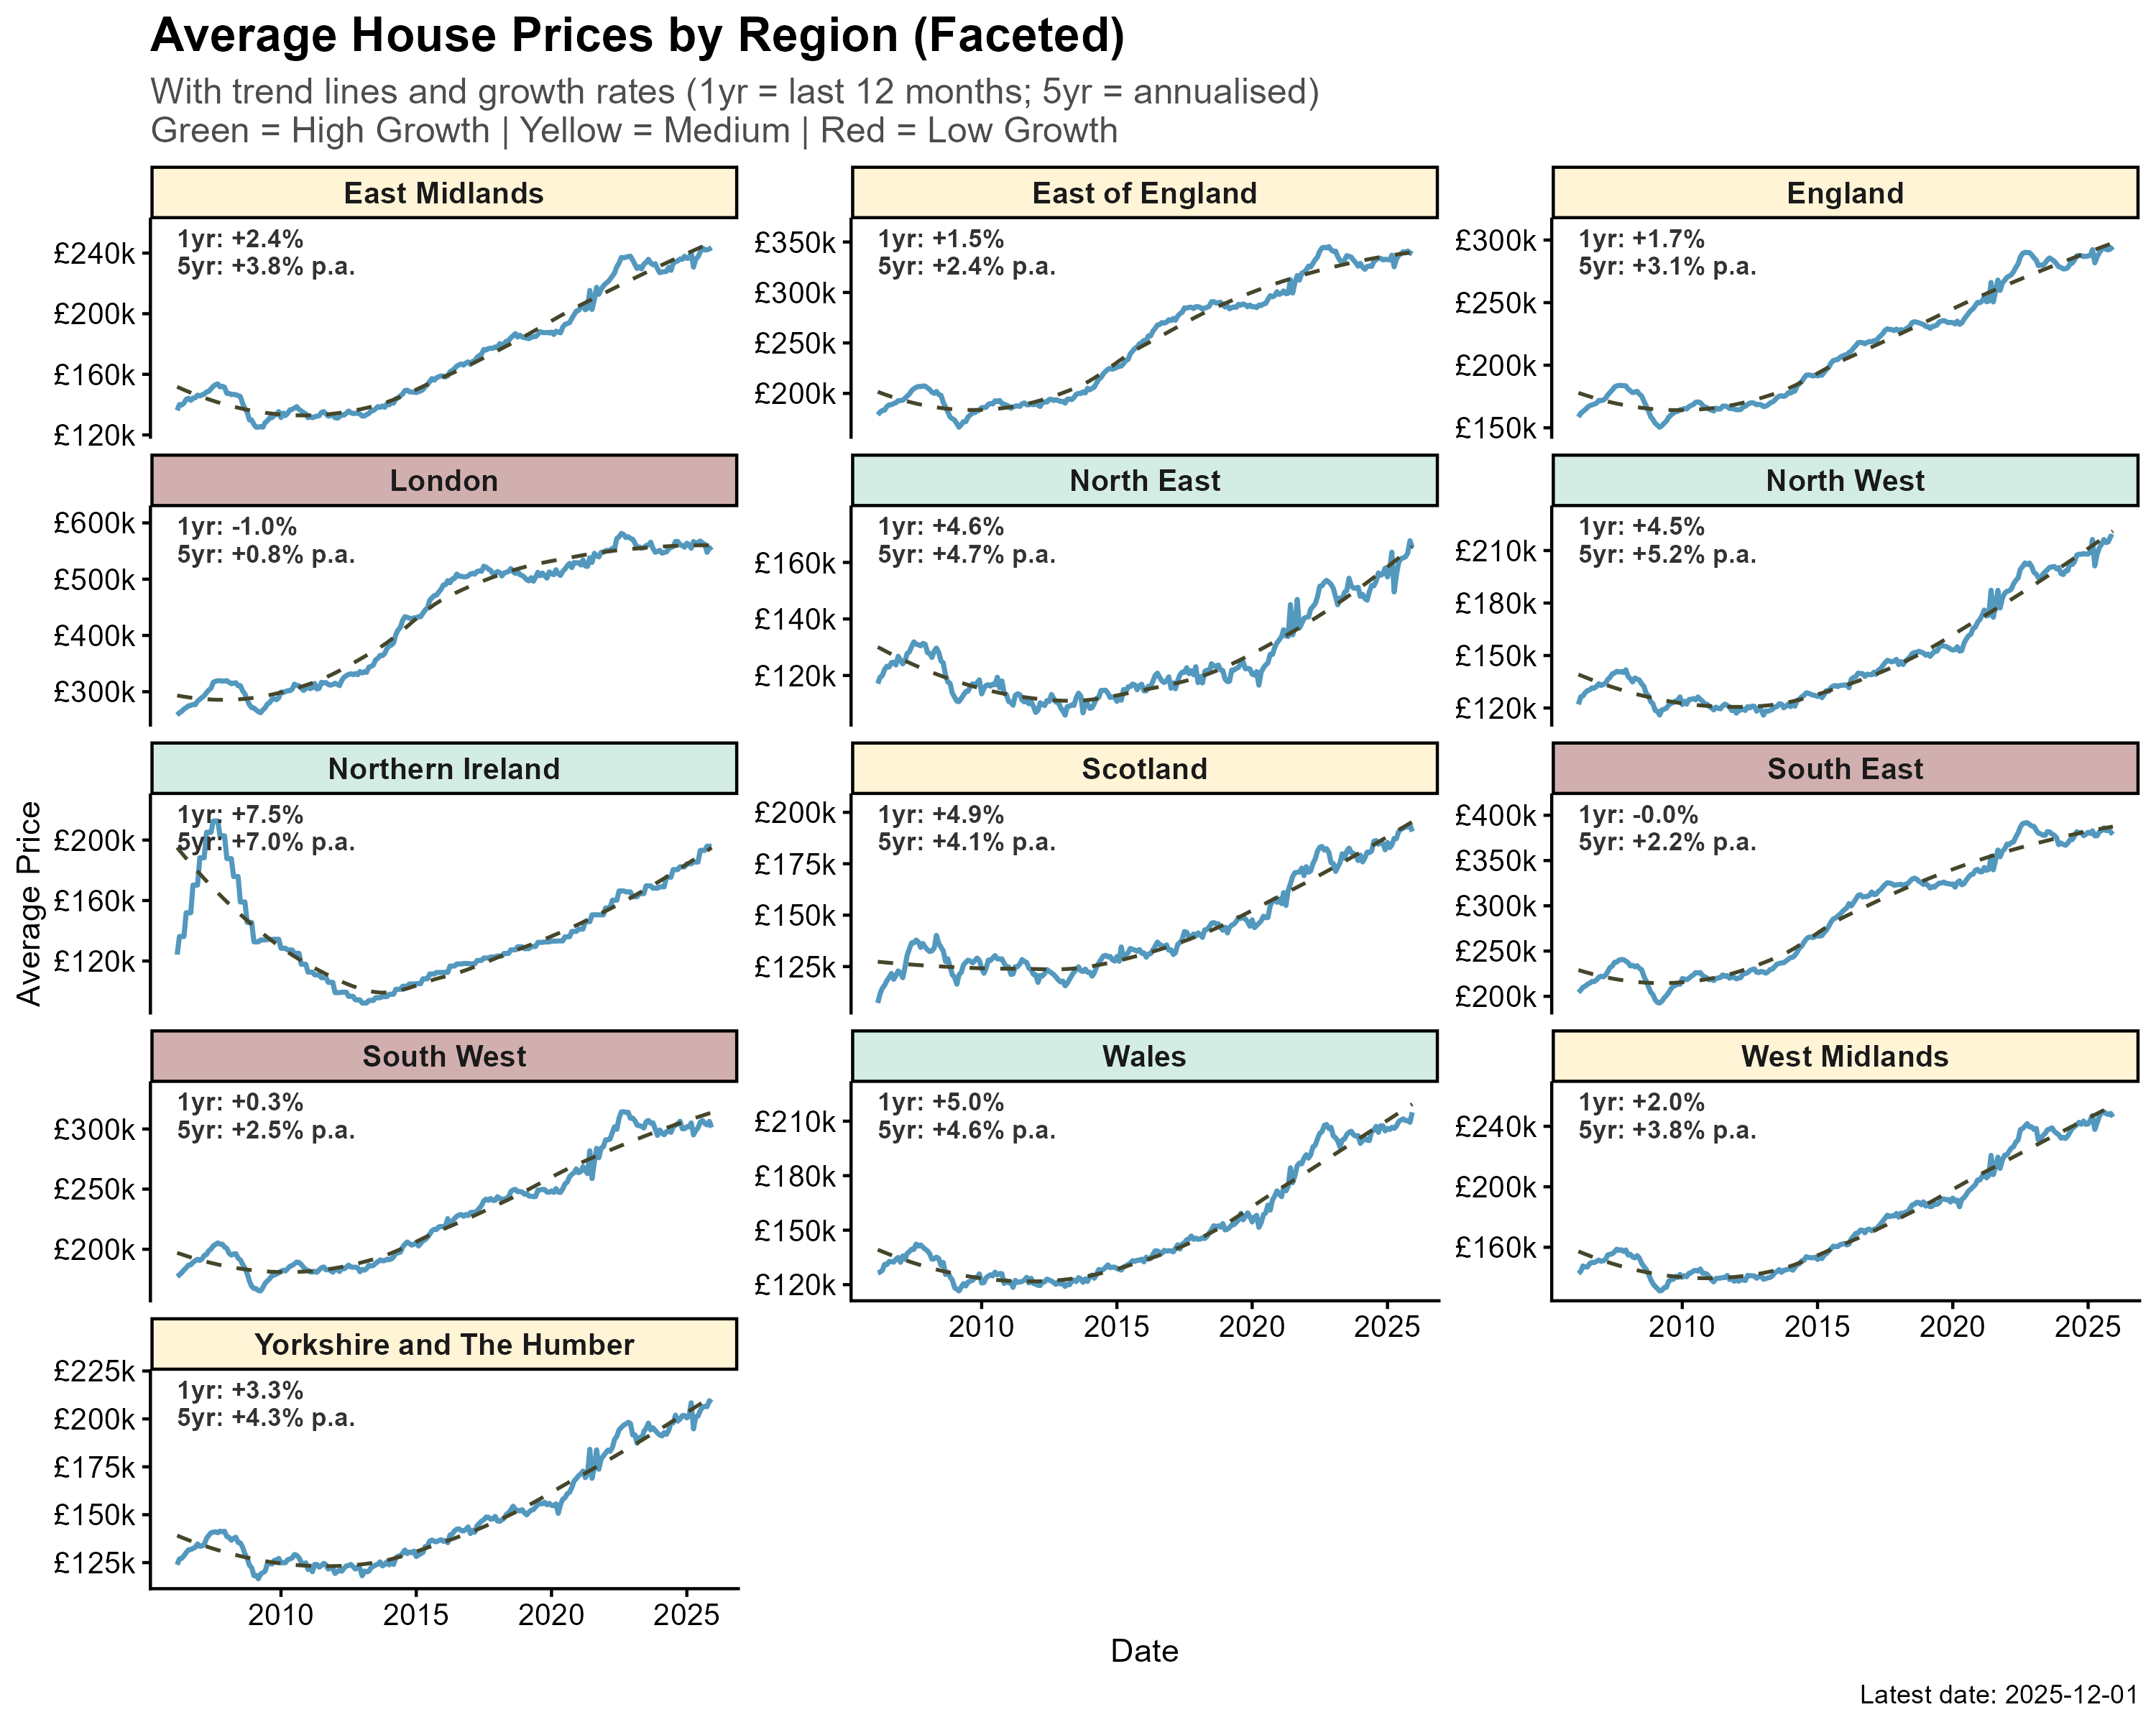
Regional house price growth tells a clear north–south story. Northern Ireland leads the pack with annual growth of +6.3%, followed by the North West (+3.1%) and Yorkshire and The Humber (+3.0%), reflecting strong demand and relative affordability across these regions. The Midlands and Wales are also holding up, posting solid gains of between +2.0% and +2.4%. At the other end of the spectrum, London is the only region recording a notable decline, with prices falling -1.7% over the past year, while the South East (-0.5%) and South West (-0.1%) are broadly flat, suggesting affordability pressures continue to weigh on the higher-priced southern markets.
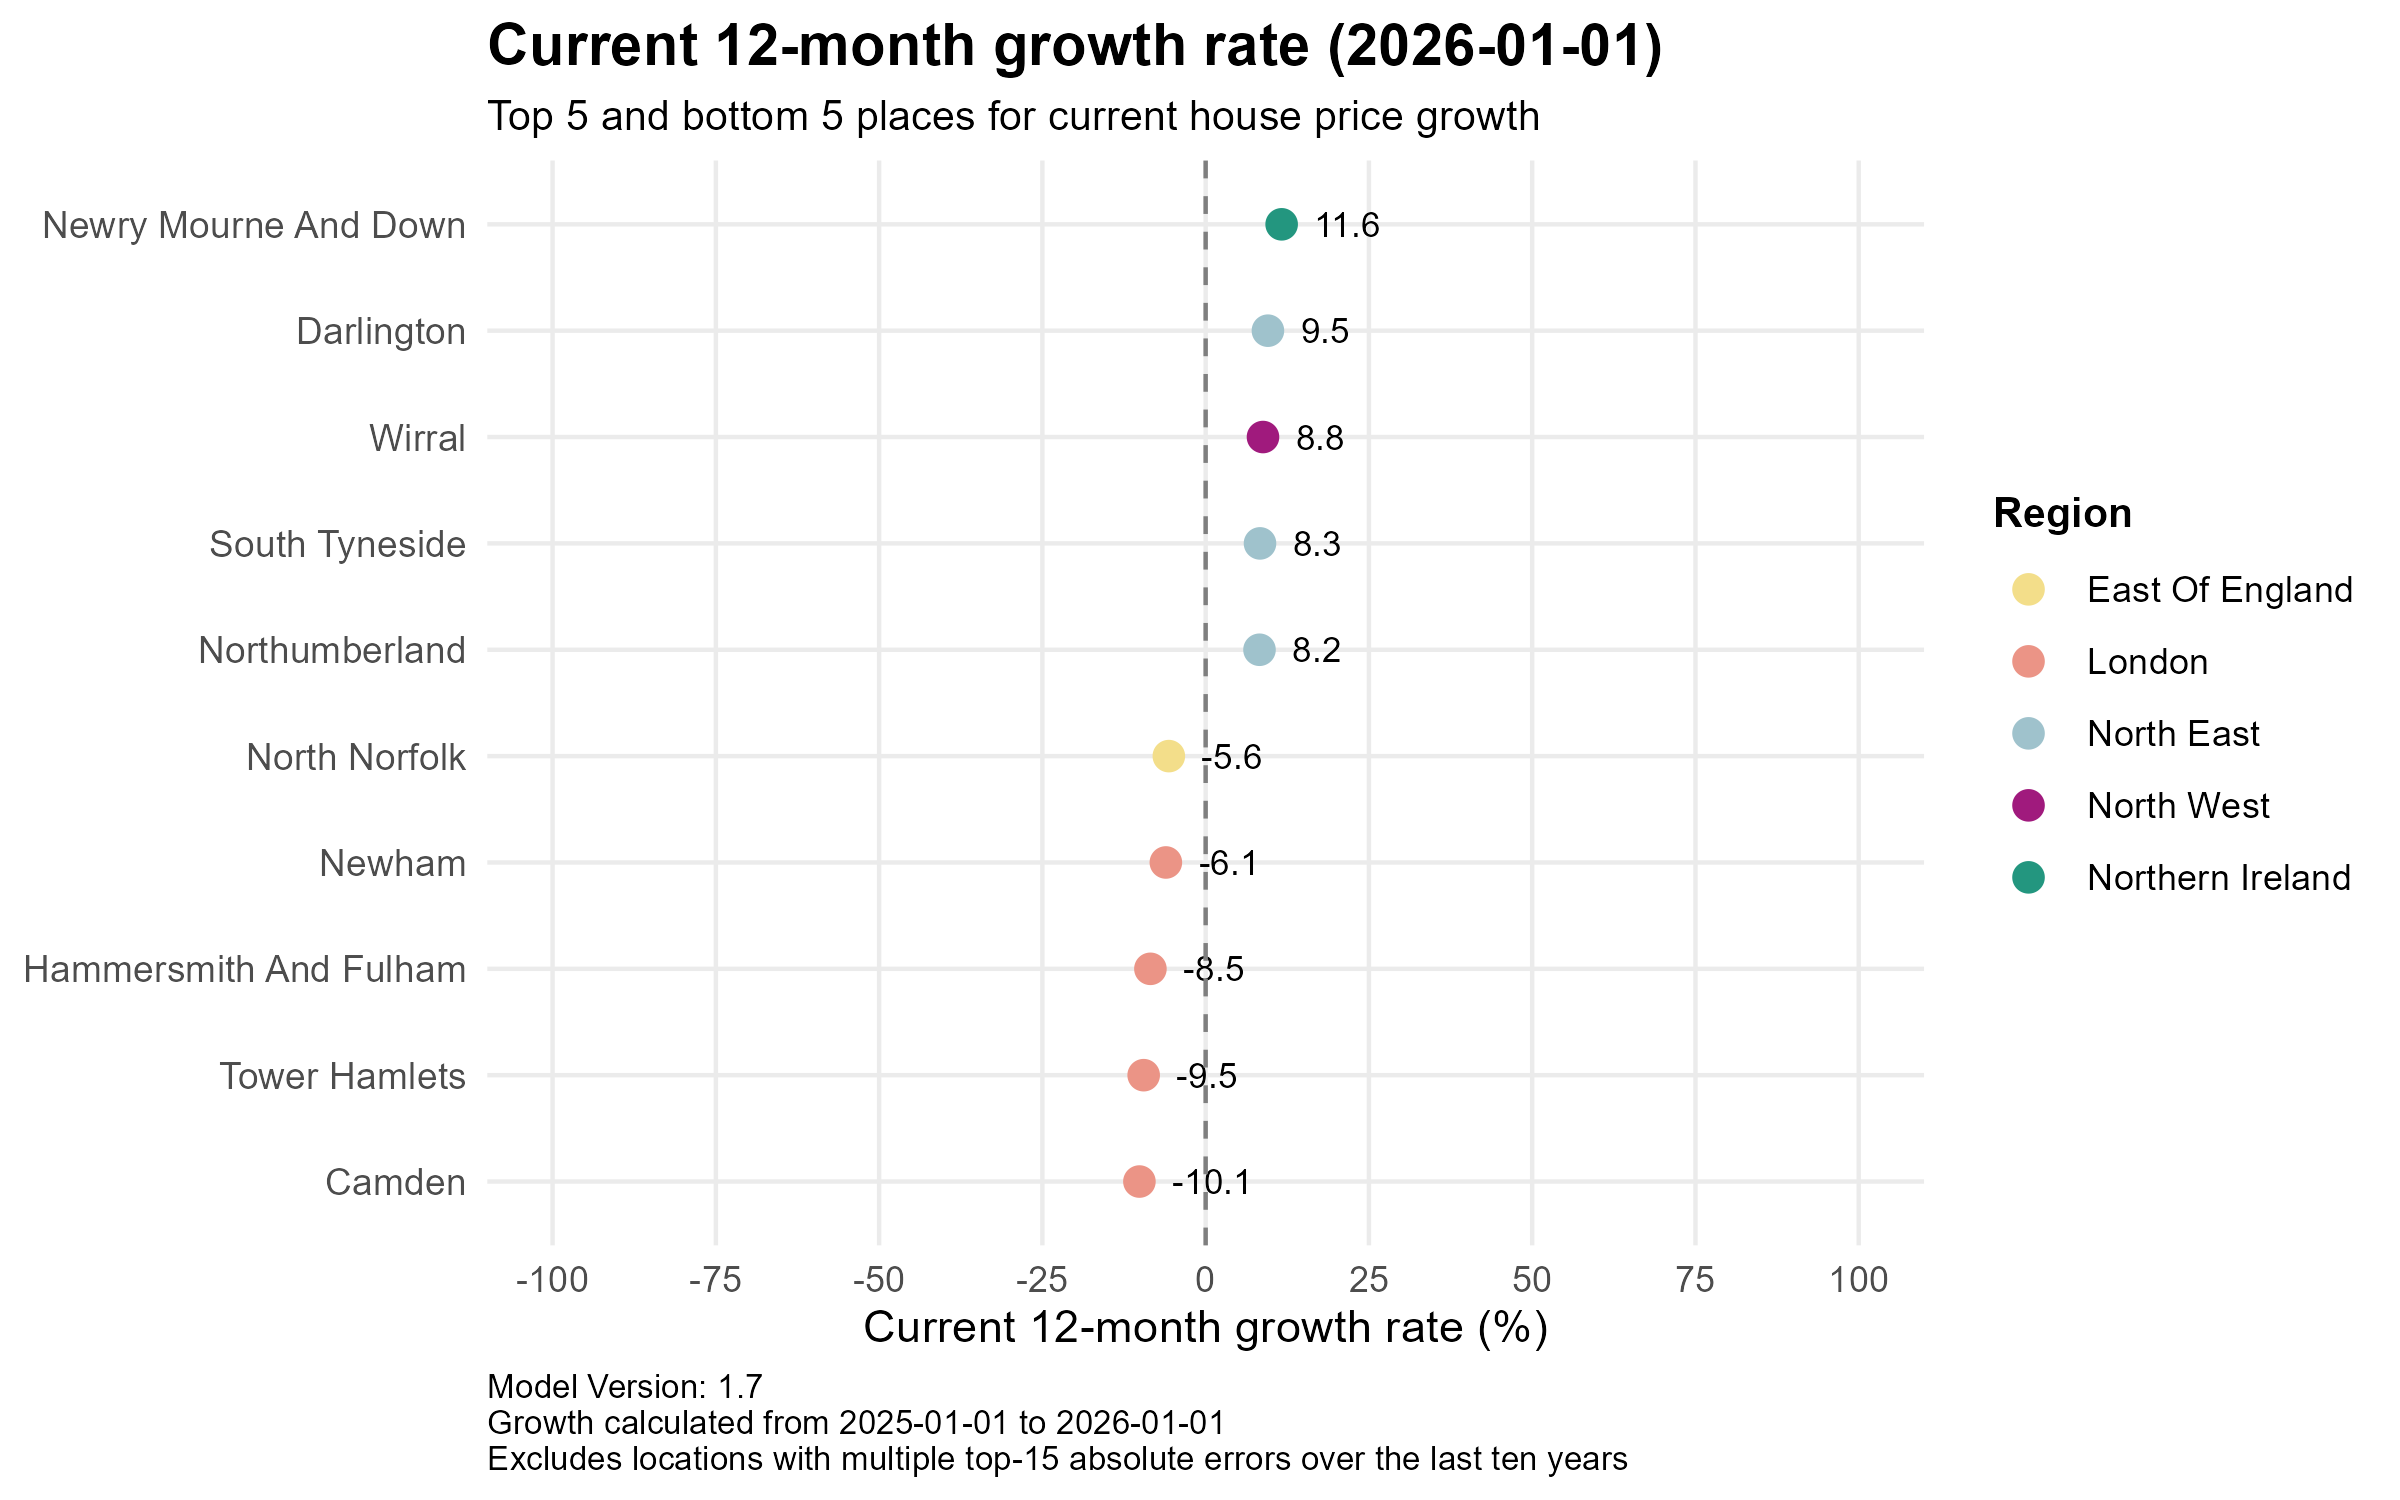
At the local level, the divide becomes even more striking. Newry Mourne and Down tops the table with an exceptional 12-month growth rate of +11.6%, with Darlington (+9.5%), Wirral (+8.8%), South Tyneside (+8.3%) and Northumberland (+8.2%) completing a top five drawn entirely from Northern Ireland and the North of England, underscoring the strength of demand in more affordable markets. The bottom five tell the opposite story, and are dominated by London boroughs: Camden (-10.1%), Tower Hamlets (-9.5%) and Hammersmith and Fulham (-8.5%) are all seeing sharp price falls, joined by Newham (-6.1%) and North Norfolk (-5.6%), suggesting that high-value urban markets and coastal second-home hotspots are facing the steepest corrections.
Predictions
Overall
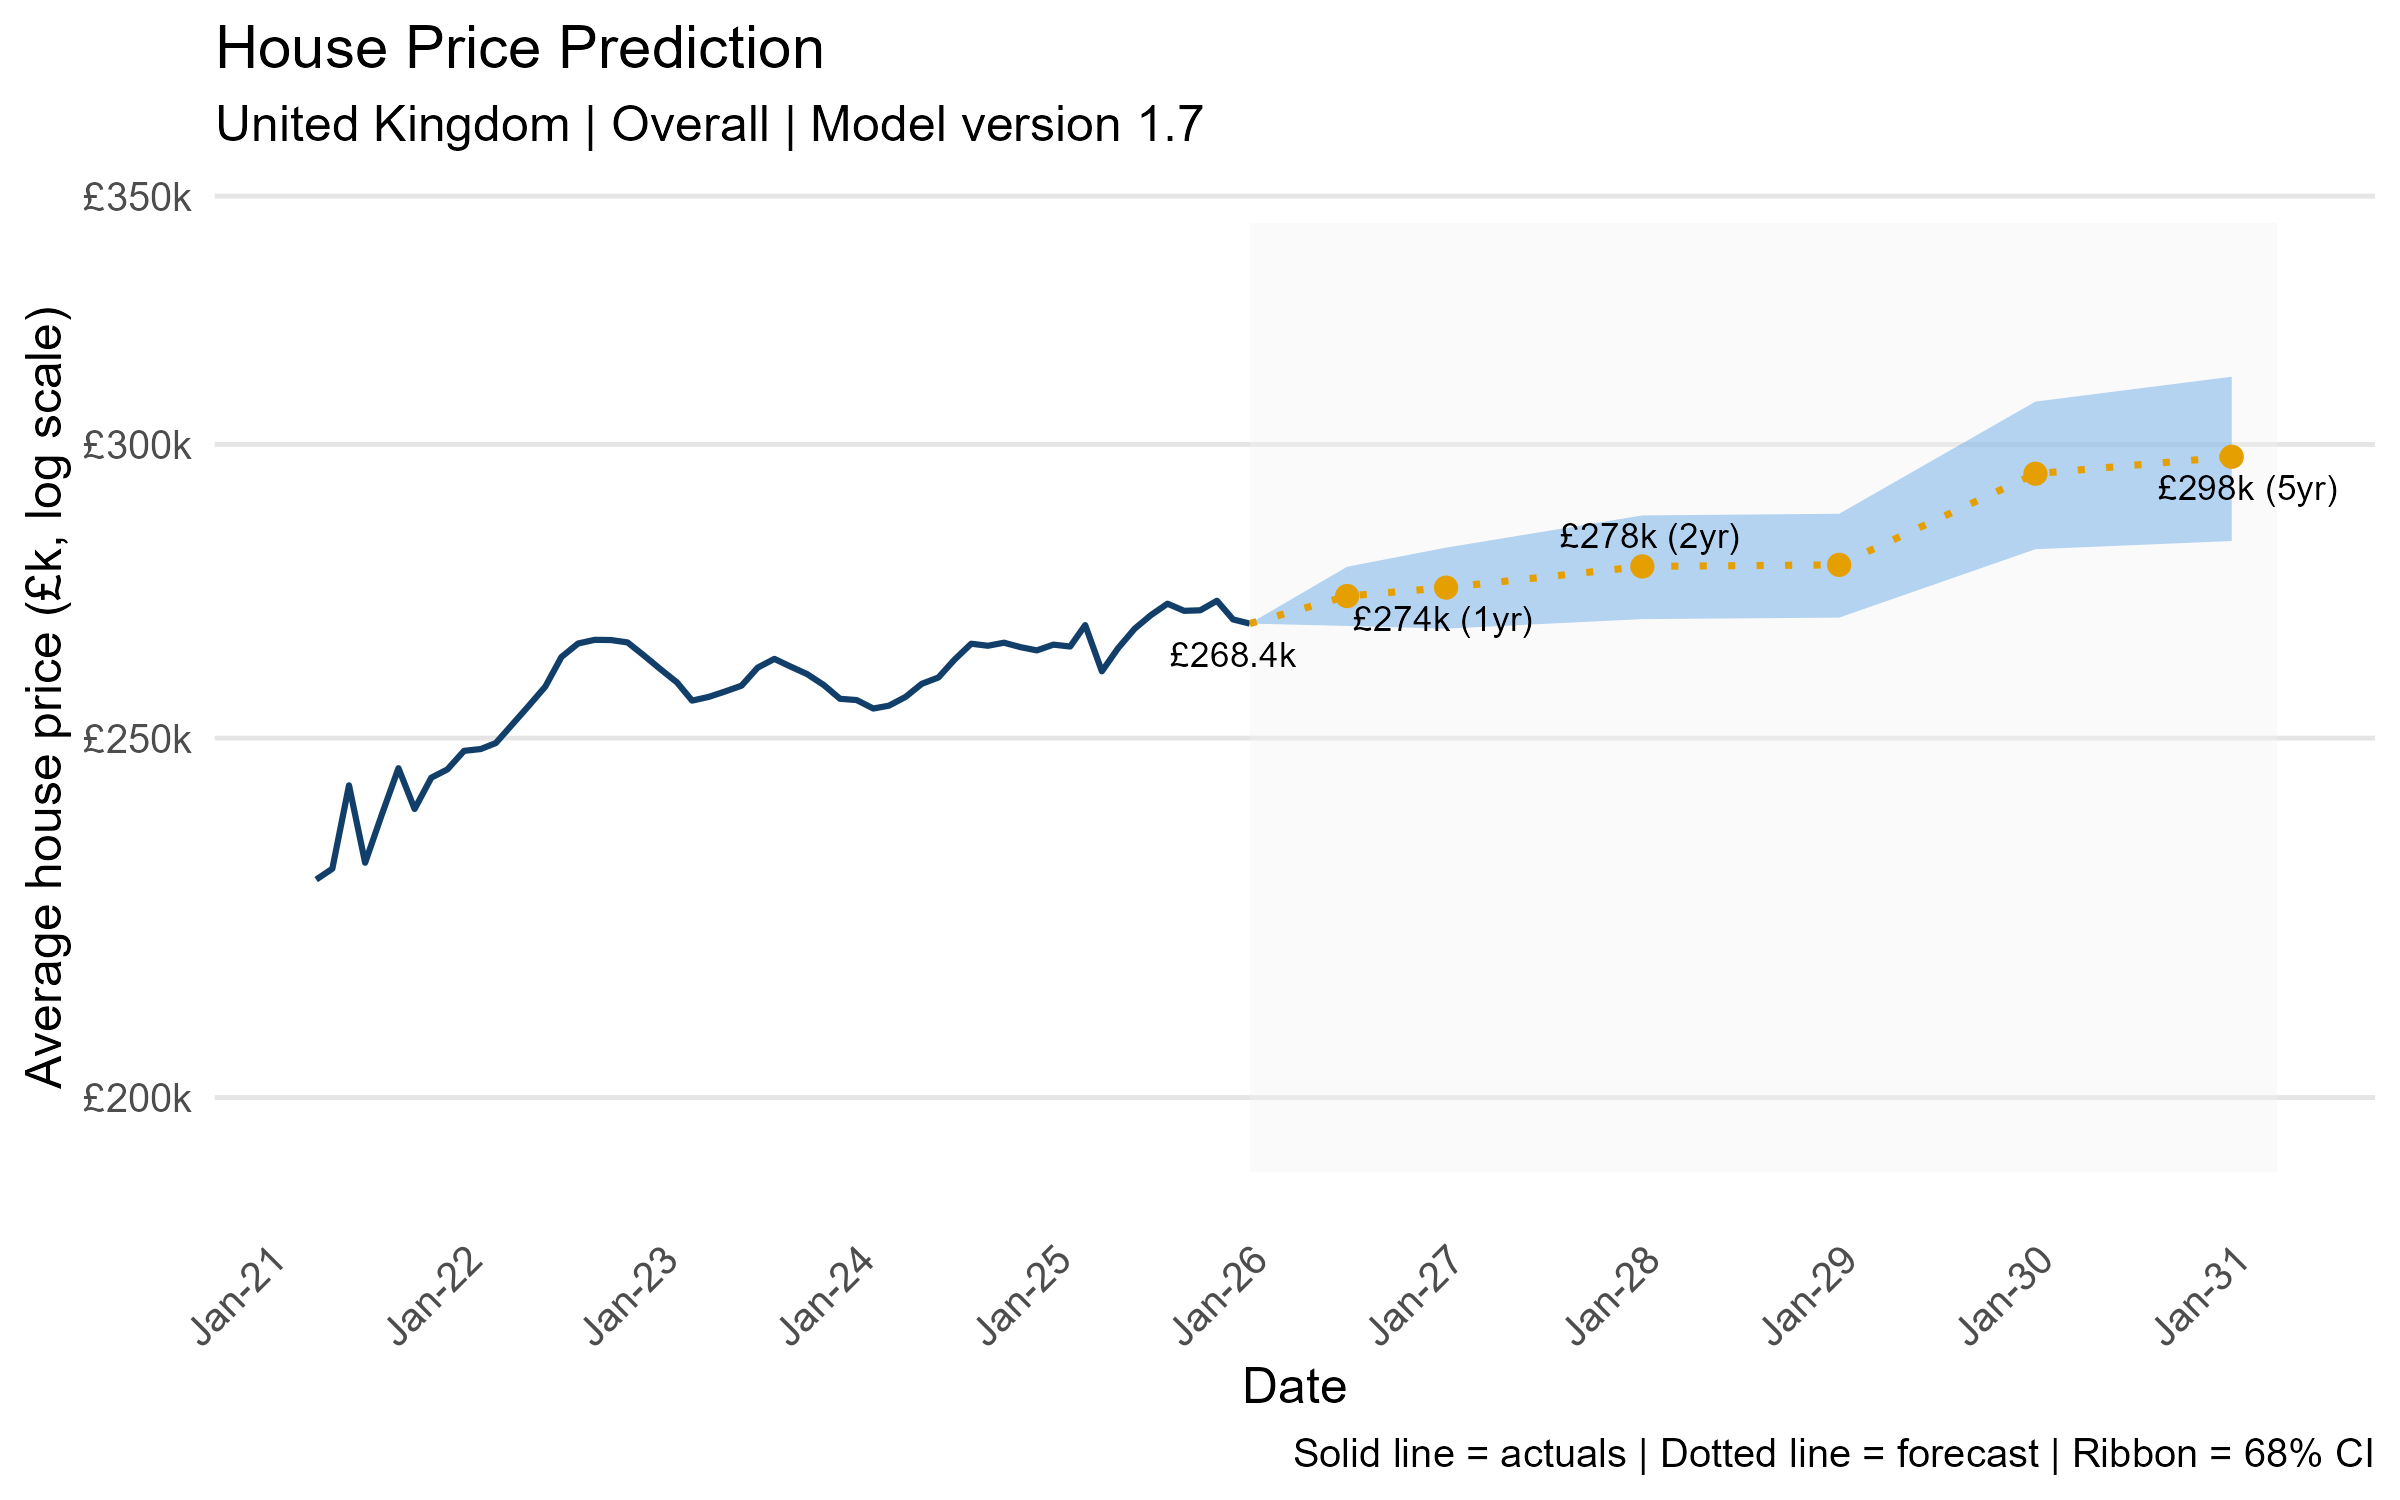
The UK average house price currently stands at ~£268k, with the model forecasting modest but steady growth over the coming years — rising to £274k within a year and £278k by 2028. The longer-term outlook points to £298k by 2031, representing an increase of around 11% over five years, though the widening confidence interval reflects the growing uncertainty in that horizon.
Regional
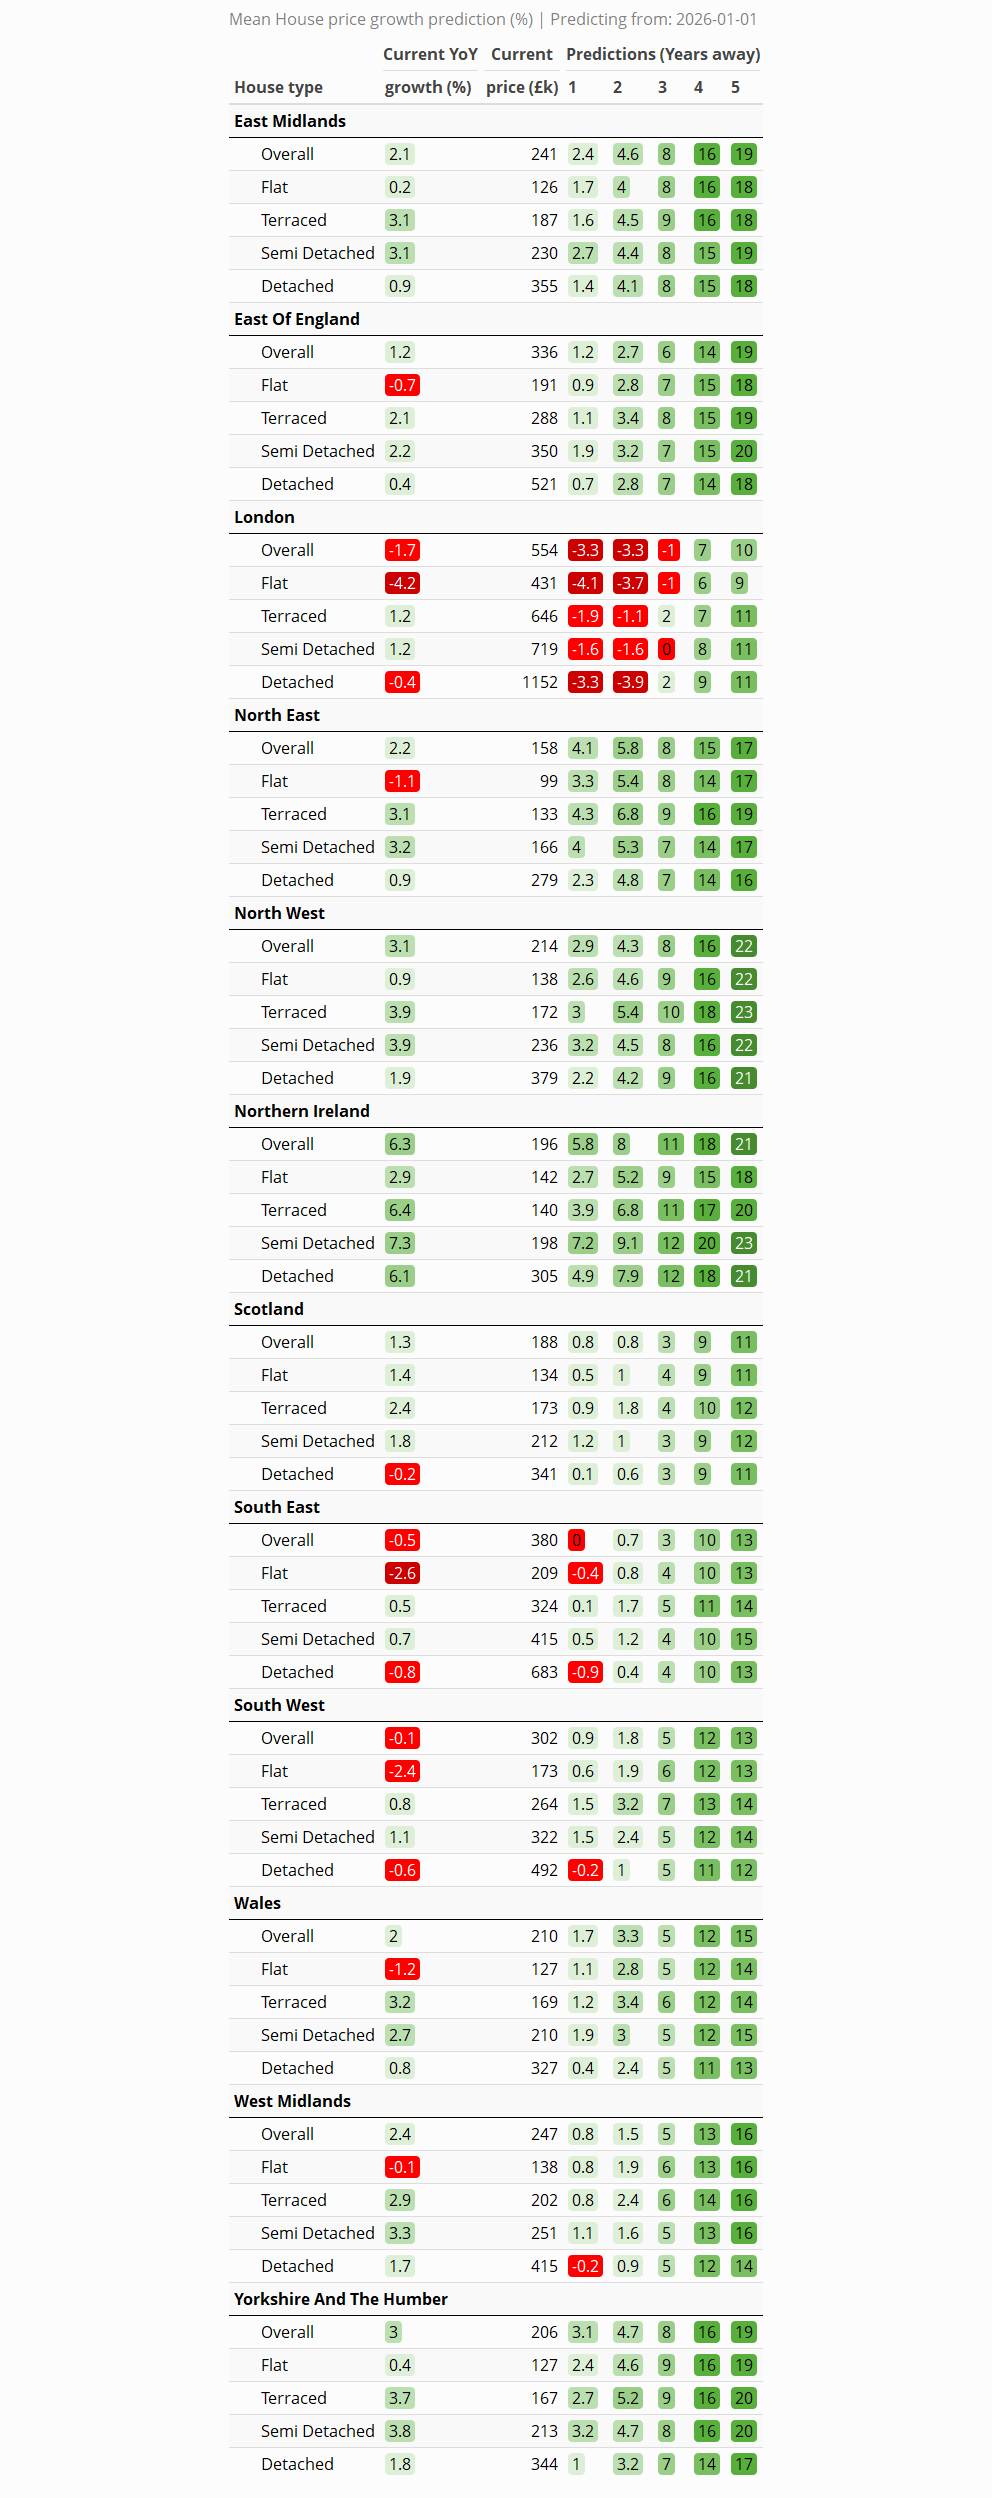
Short term (years 1–2): London is the clear outlier in the near term, with prices forecast to fall around 3.3% in both of the next two years across most property types. Elsewhere, growth is modest but positive, with Northern Ireland (+5.8% in year one) and the North East and Yorkshire leading the way.
Medium term (years 3–4): By the middle of the forecast period, London begins to recover, turning positive in year three and reaching around +7% by year four. Northern Ireland accelerates strongly to +11% over four years, while the North West, East Midlands and Yorkshire are all forecast to hit double-digit cumulative gains.
Long term (year 5): The North West emerges as the strongest performer over the full five-year horizon at +22%, closely followed by Northern Ireland (+21%) and Yorkshire and The Humber (+19%). London and Scotland lag behind the national picture, reaching +10% and +11% respectively — solid gains, but well below the growth expected across the more affordable northern and Irish markets.
Local
12-month prediction (to January 2027)
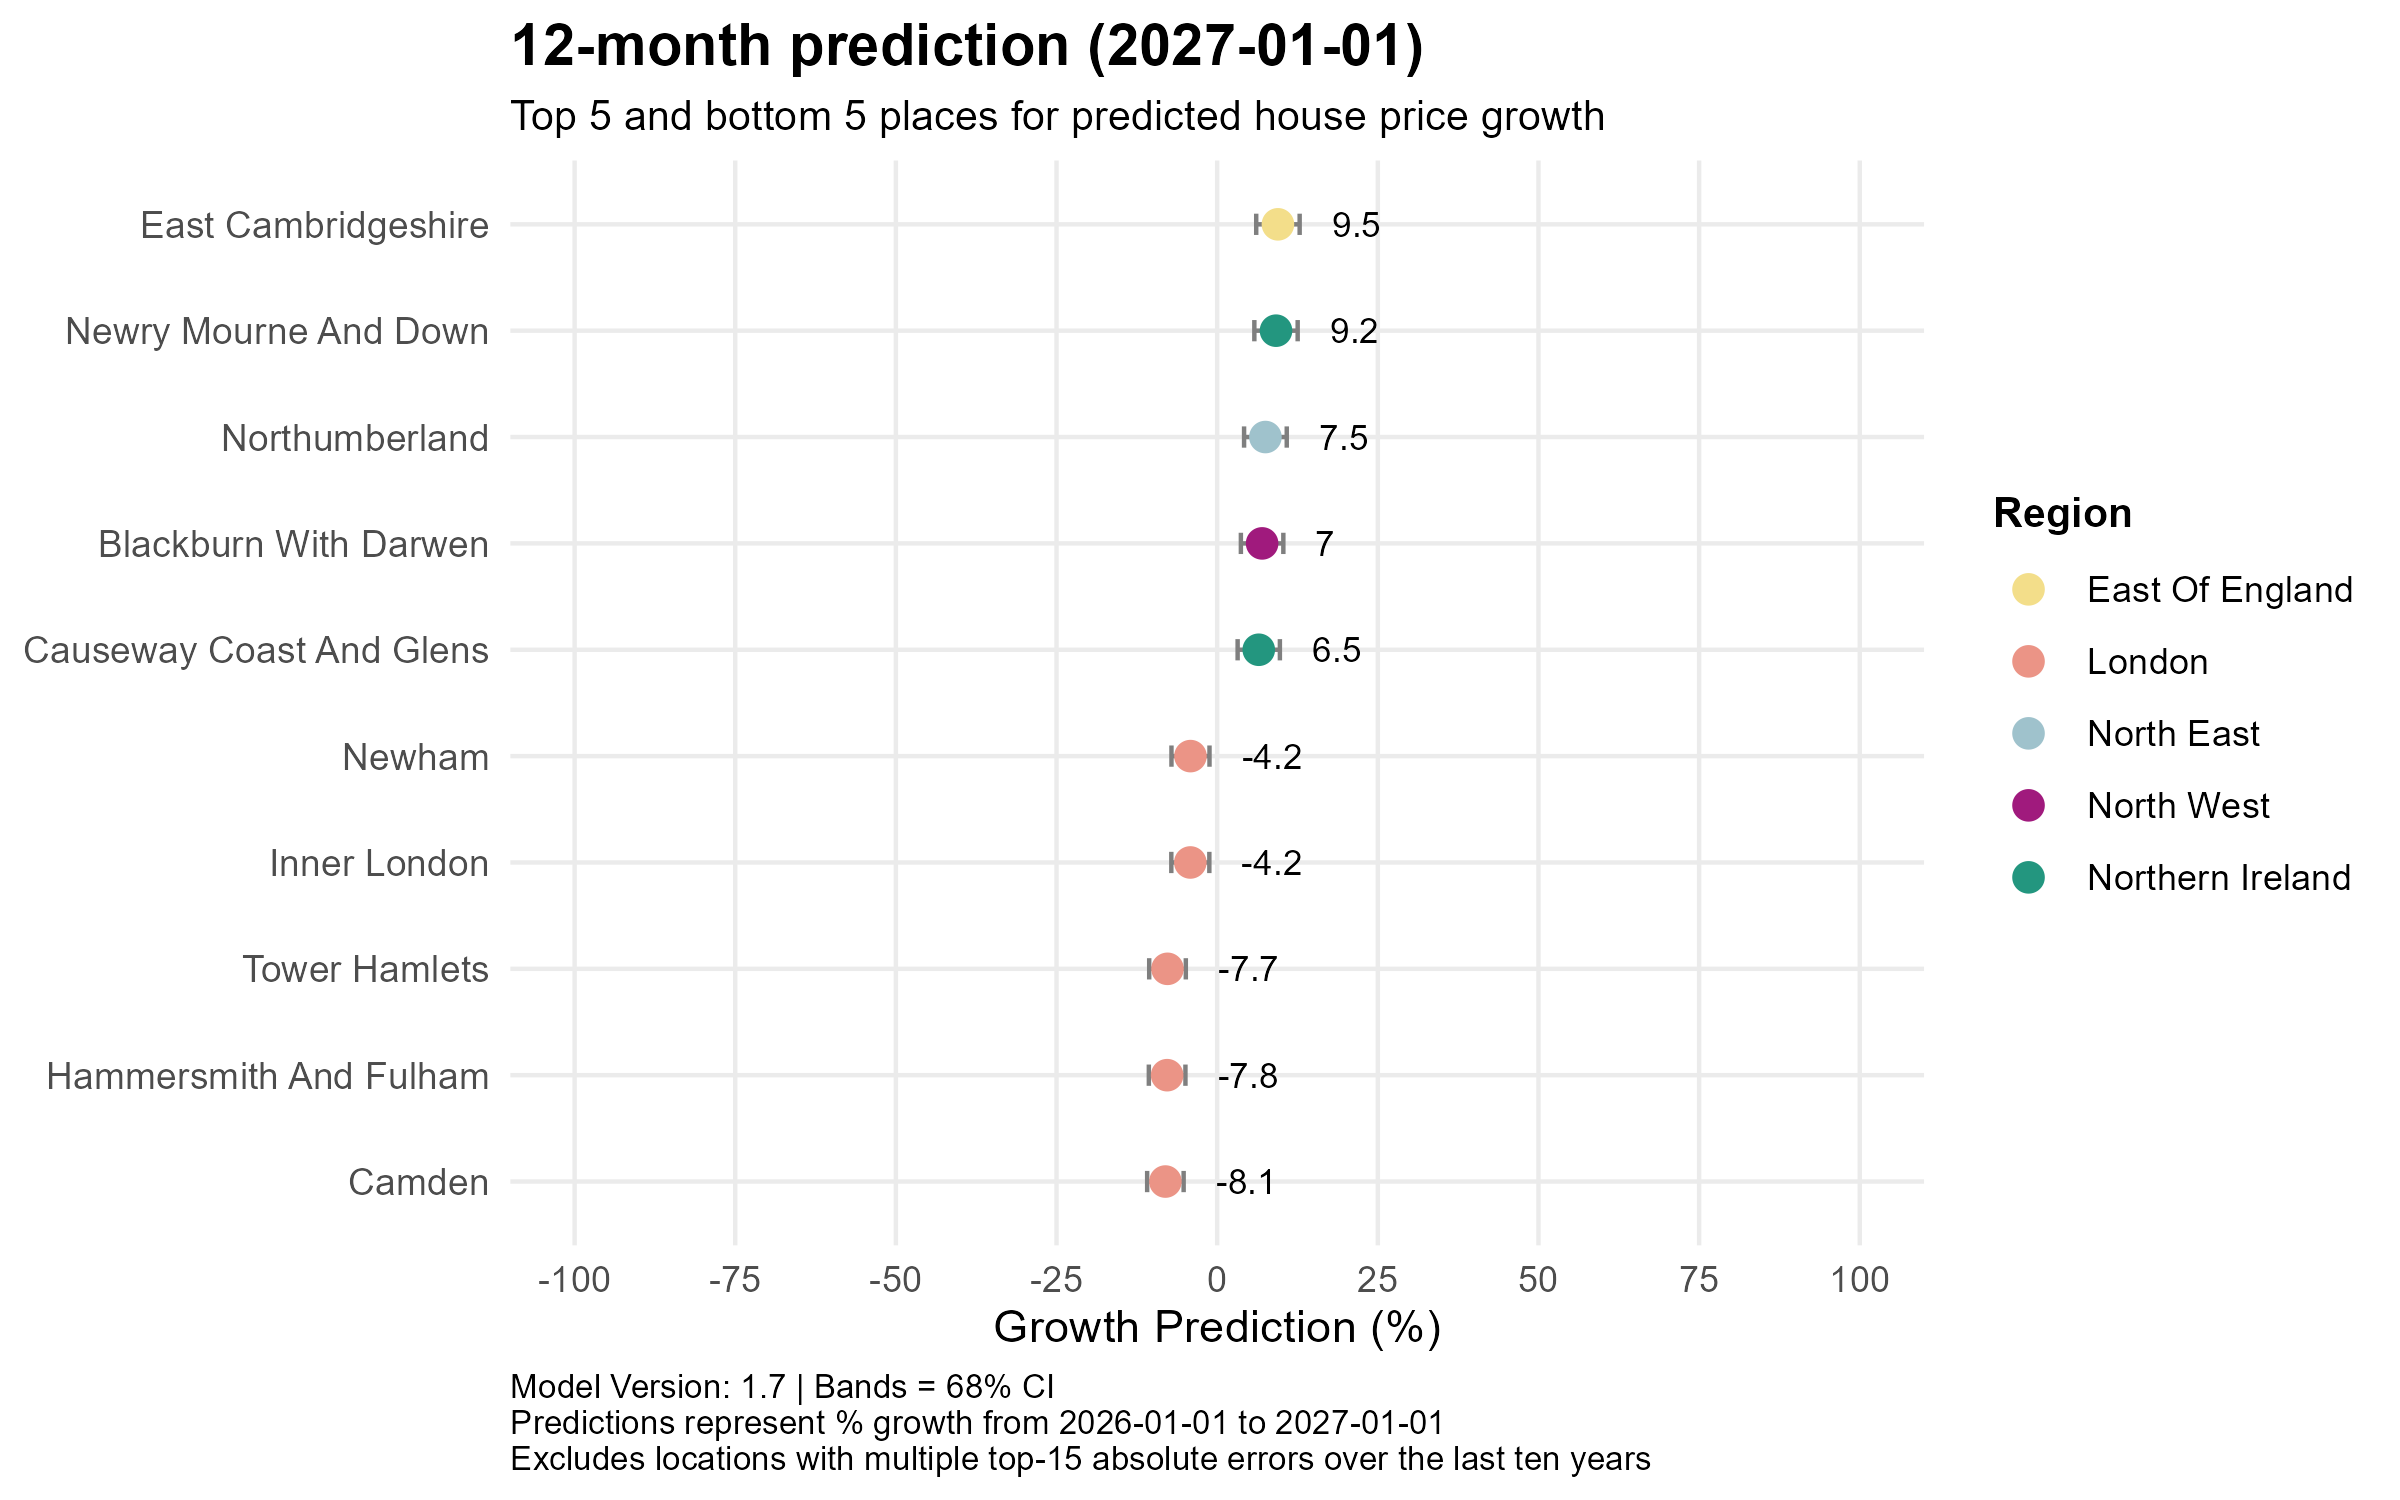
The near-term picture is geographically diverse at the top, with East Cambridgeshire (East of England) leading at +9.5%, followed by Newry Mourne And Down in Northern Ireland at +9.2% and Northumberland in the North East at +7.5%. Blackburn With Darwen and Causeway Coast And Glens round out the top five at +7.0% and +6.5% respectively. The bottom five are almost exclusively London boroughs, with Camden forecast to fall -8.1%, Hammersmith And Fulham -7.8% and Tower Hamlets -7.7%.
24-month prediction (to January 2028)
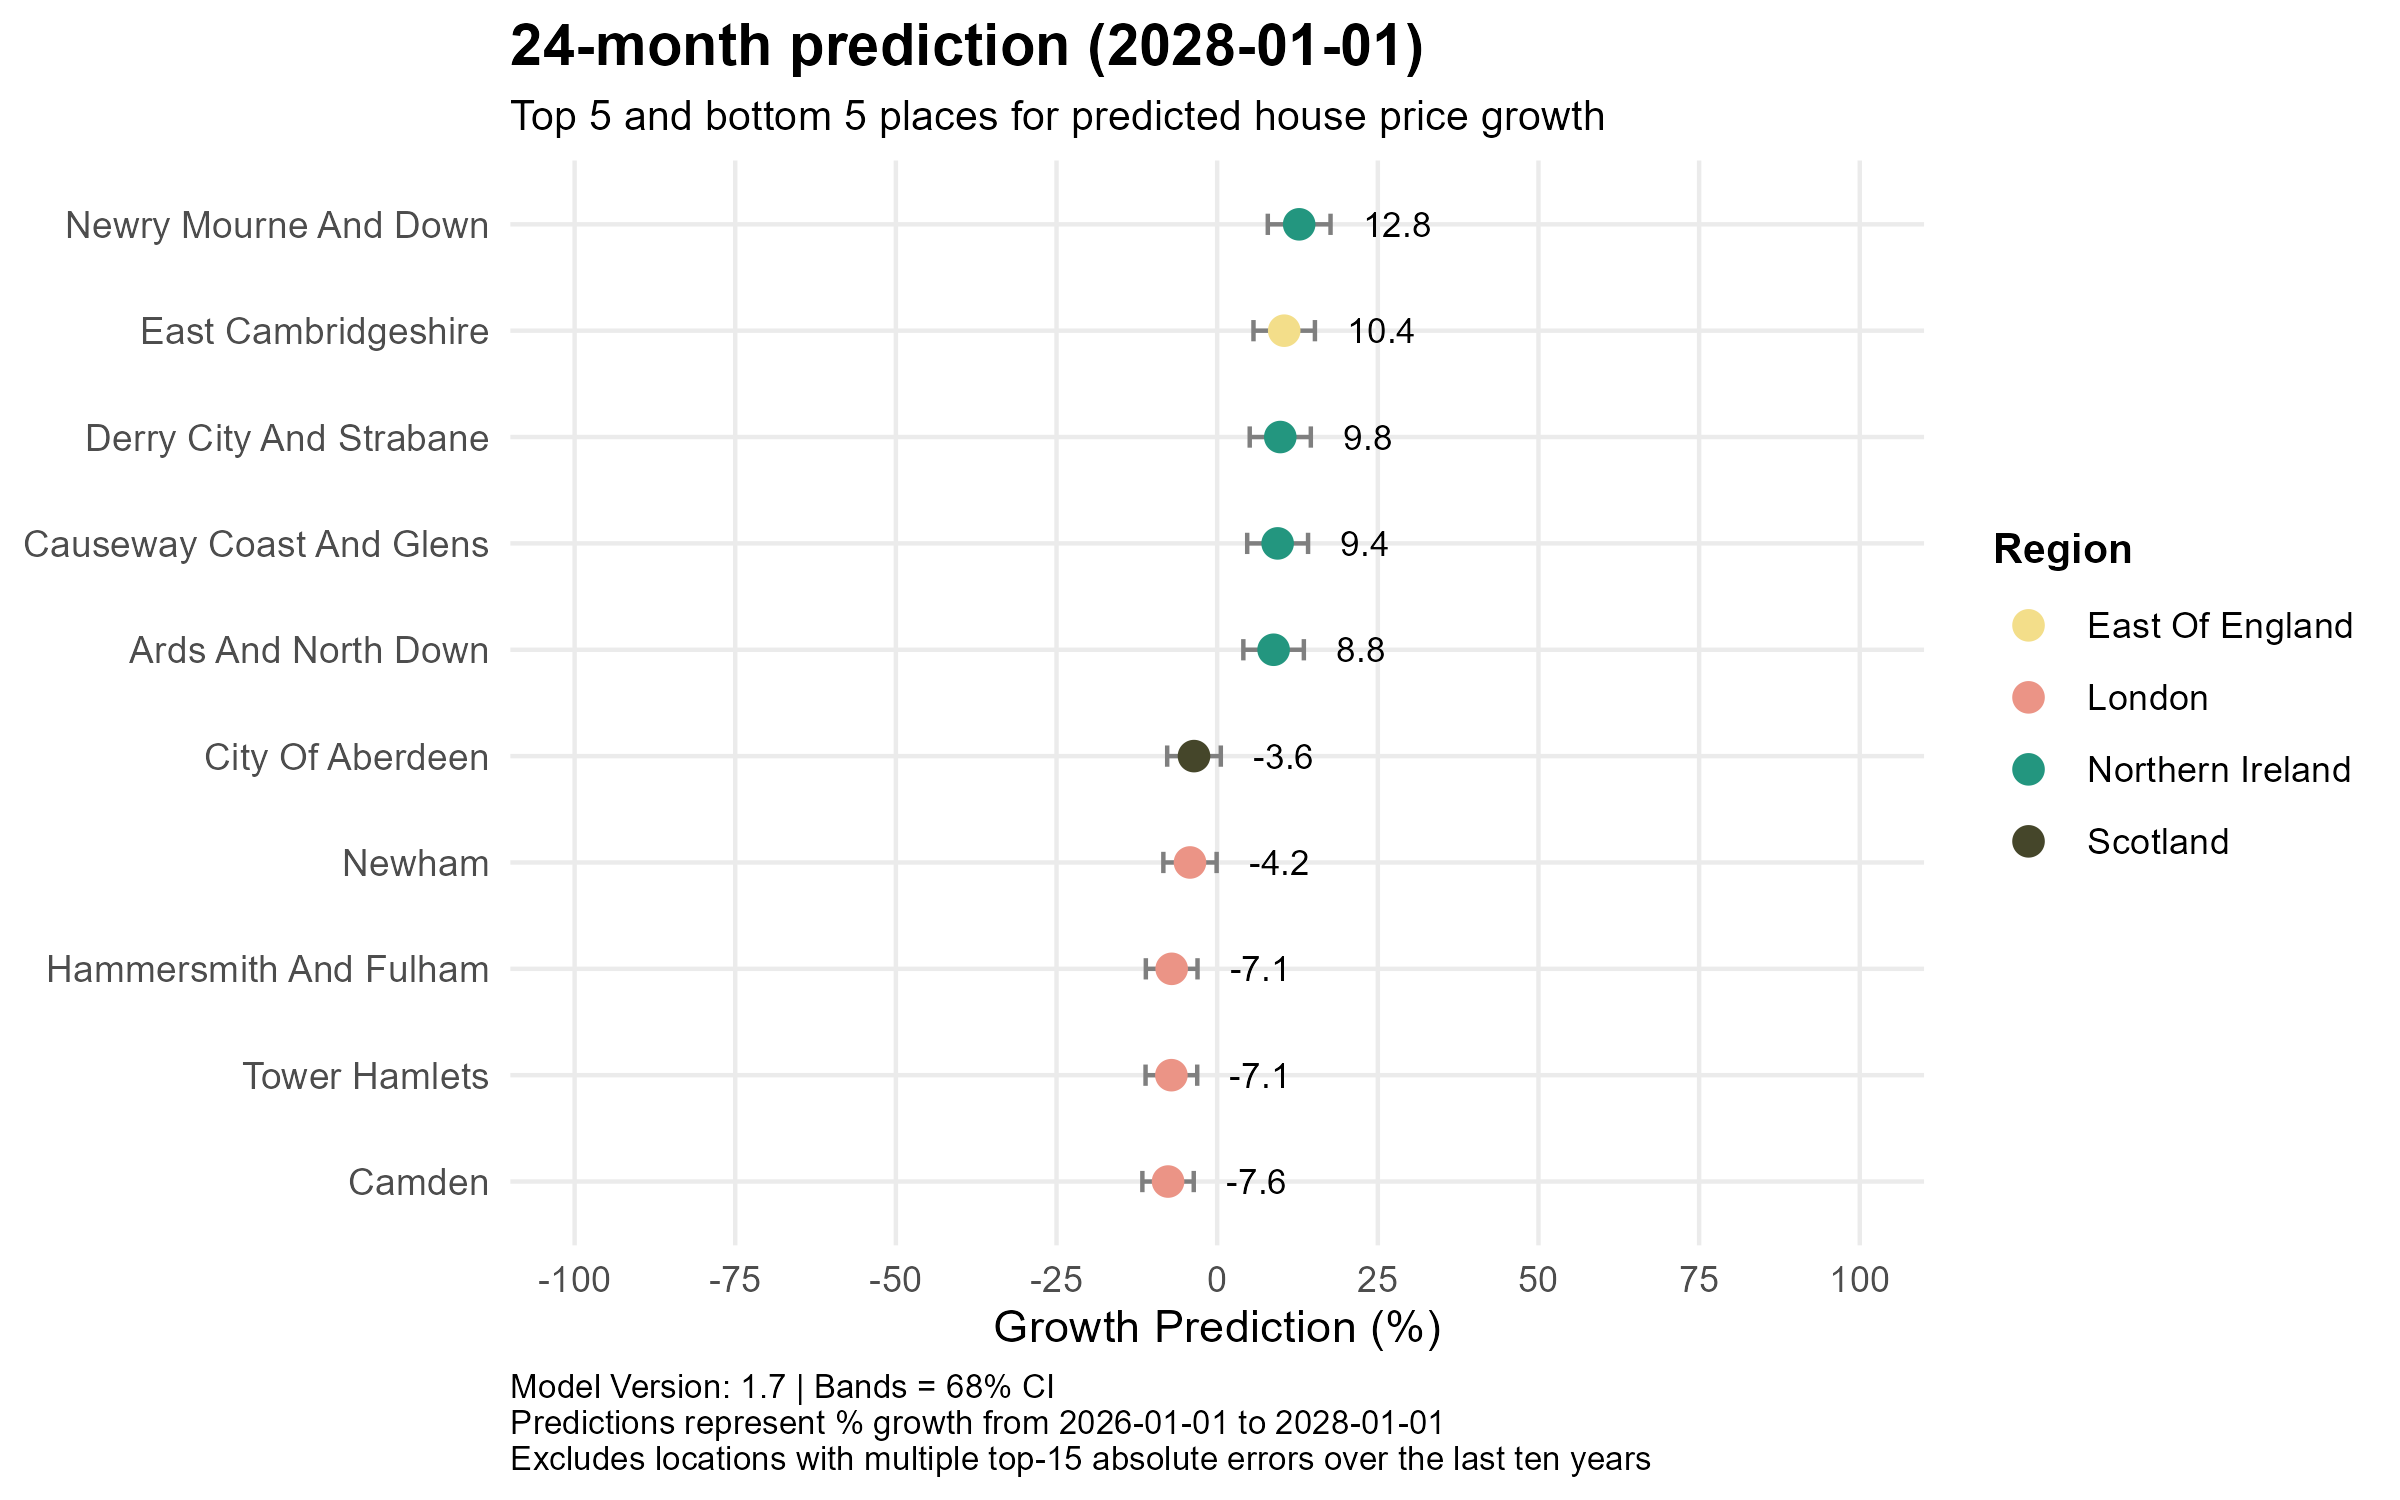
Northern Ireland dominates the top five over two years, with Newry Mourne And Down surging to +12.8% cumulative growth, joined by Derry City And Strabane (+9.8%), Causeway Coast And Glens (+9.4%) and Ards And North Down (+8.8%) — East Cambridgeshire is the sole non-Northern Irish entry at +10.4%. London boroughs continue to struggle at the bottom, with Camden (-7.6%), Tower Hamlets and Hammersmith And Fulham (both -7.1%) and Newham (-4.2%) all in negative territory, now joined by City of Aberdeen in Scotland (-3.6%).
60-month prediction (to January 2031)
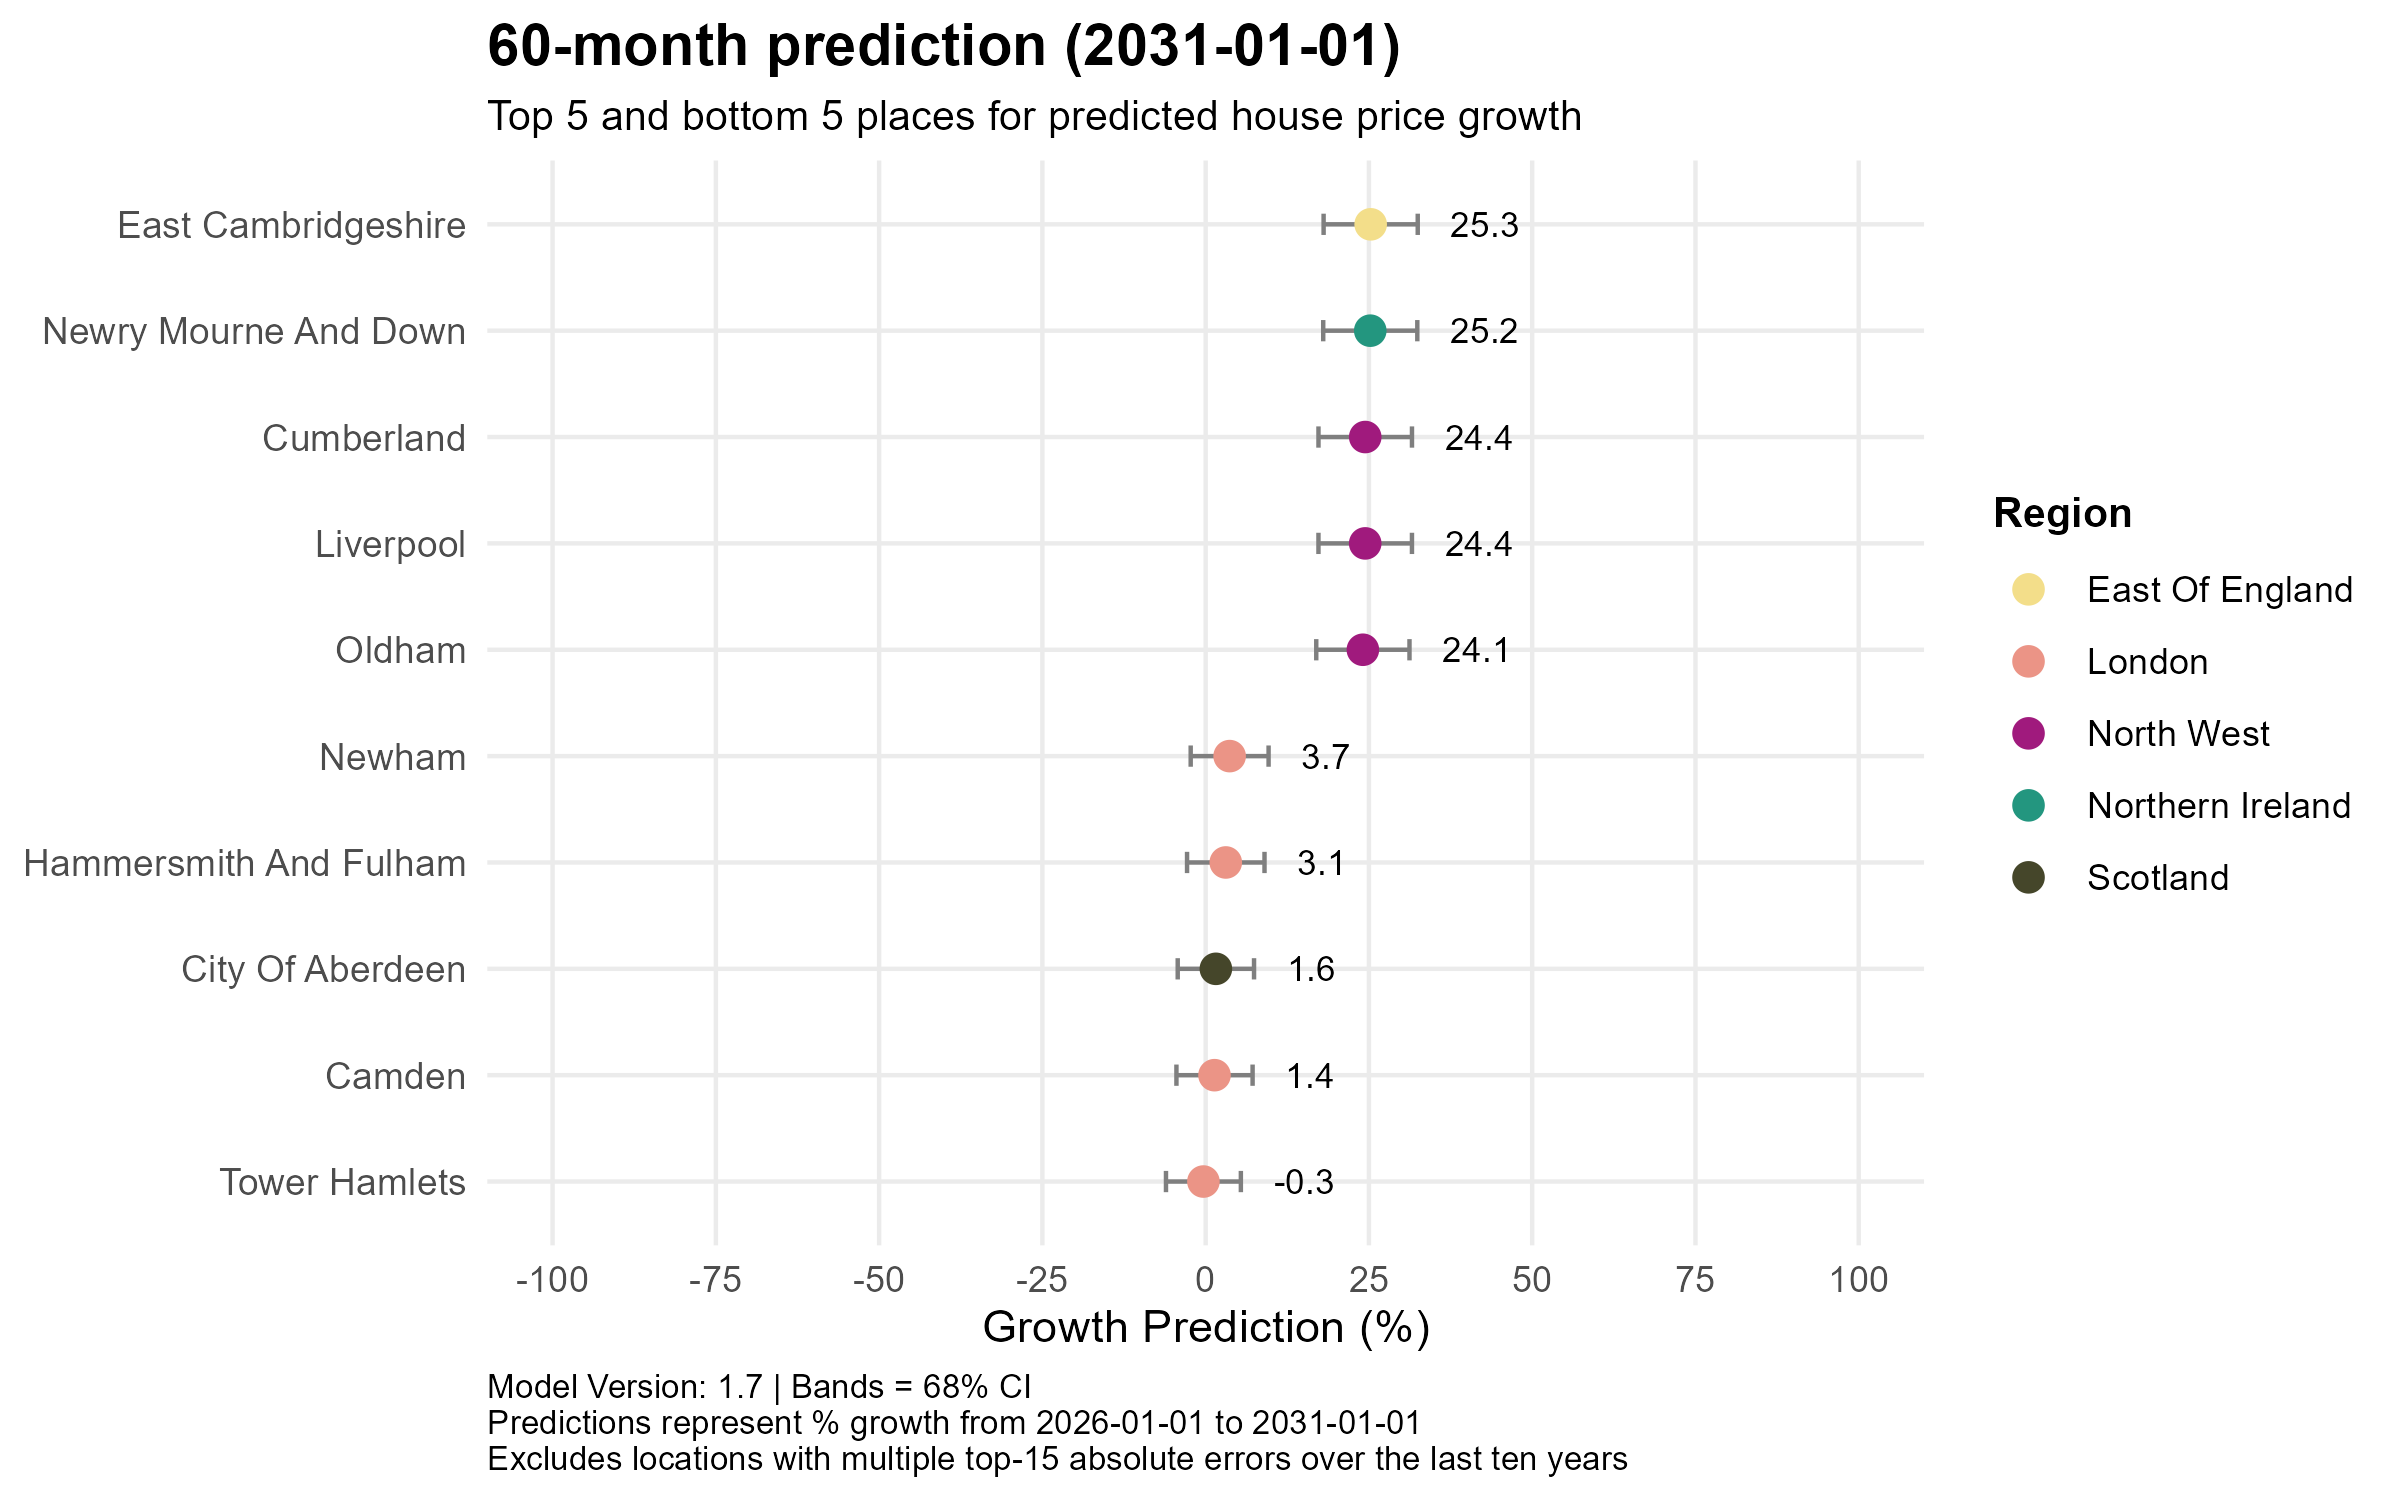
Over five years, the gap between winners and losers narrows significantly, as even the weakest performers largely recover, the notable exception being Tower Hamlets, which is the only location still fractionally negative at -0.3%. East Cambridgeshire (+25.3%) and Newry Mourne And Down (+25.2%) top the long-term table, with North West locations: Cumberland, Liverpool and Oldham all clustered around +24%. The London boroughs that struggled in the short term bring up the rear, posting only modest cumulative gains of between +1.4% and +3.7% over the full five years.
Across all three time horizons, a consistent narrative emerges: affordability is the defining driver of UK house price growth. Northern Ireland, the North West and parts of the North East repeatedly feature among the strongest performers, whilst London boroughs (particularly Camden, Tower Hamlets and Hammersmith And Fulham) face a prolonged period of underperformance. Encouragingly, the five-year view suggests that even the weakest markets largely recover, pointing to a rebalancing rather than a structural collapse in London values. For buyers and investors alike, the data makes a compelling case for looking north and west.
- UK House price prediction – February 2026
Economic summary
News
The economic picture has been mixed since the last post. GDP grew just 0.1% in Q4 2025, capping a full-year figure of 1.3% (positive), but below the OBR’s 1.5% forecast. The labour market has softened noticeably: unemployment climbed to 5.2% in the three months to December, its highest since early 2021, with youth unemployment particularly stark at 16%. CPI inflation, however, offered some relief, falling to 3.0% in January from 3.4% in December, and the Bank of England expects it to return to around the 2% target by mid-year. The MPC held Bank Rate at 3.75% in February, but only just… a narrow 5–4 vote that was more dovish than markets expected, and a March cut is now widely anticipated. Looking ahead, forward-looking indicators have been surprisingly upbeat: the flash composite PMI hit 53.9 in February (a 22-month high), retail sales posted their fastest annual growth in nearly four years in January, and the government recorded a record budget surplus ahead of the Chancellor’s Spring Statement on 3 March.
Indicators
- Average house prices decreased very slightly to £270k on the previous month
- Mortgage rates for 75 % LTV and 95 % LTV continues to decrease
Current growth rates
Momentum remains concentrated in the north and the devolved nations. Northern Ireland leads the regional table at +7.5% over the past 12 months, followed by Wales (+5.0%), Scotland (+4.9%), the North East (+4.6%) and the North West (+4.5%). The midlands and Yorkshire sit in the mid-single digits, while the southern regions lag well behind — London is in outright decline at −1.0%, the South East is flat (−0.0%) and the South West barely positive at +0.3%. On a five-year annualised view the picture is broadly similar: Northern Ireland (+7.0% p.a.) and the North West (+5.2% p.a.) top the table, while the South East (+2.2% p.a.) and East of England (+2.4% p.a.) bring up the rear.
The affordability chart helps explain this divergence. The national home-affordability factor has drifted back down close to its long-run average after the sharp spike in 2021–22, but the regional spread remains wide. London, despite its price correction, is still far less affordable than anywhere else, sitting around 14× weekly earnings — down from nearly 18× at its peak but still well above the national average of roughly 9×. By contrast, the North East, Scotland and Northern Ireland remain among the most affordable regions, leaving considerably more headroom for price growth before affordability becomes a binding constraint.
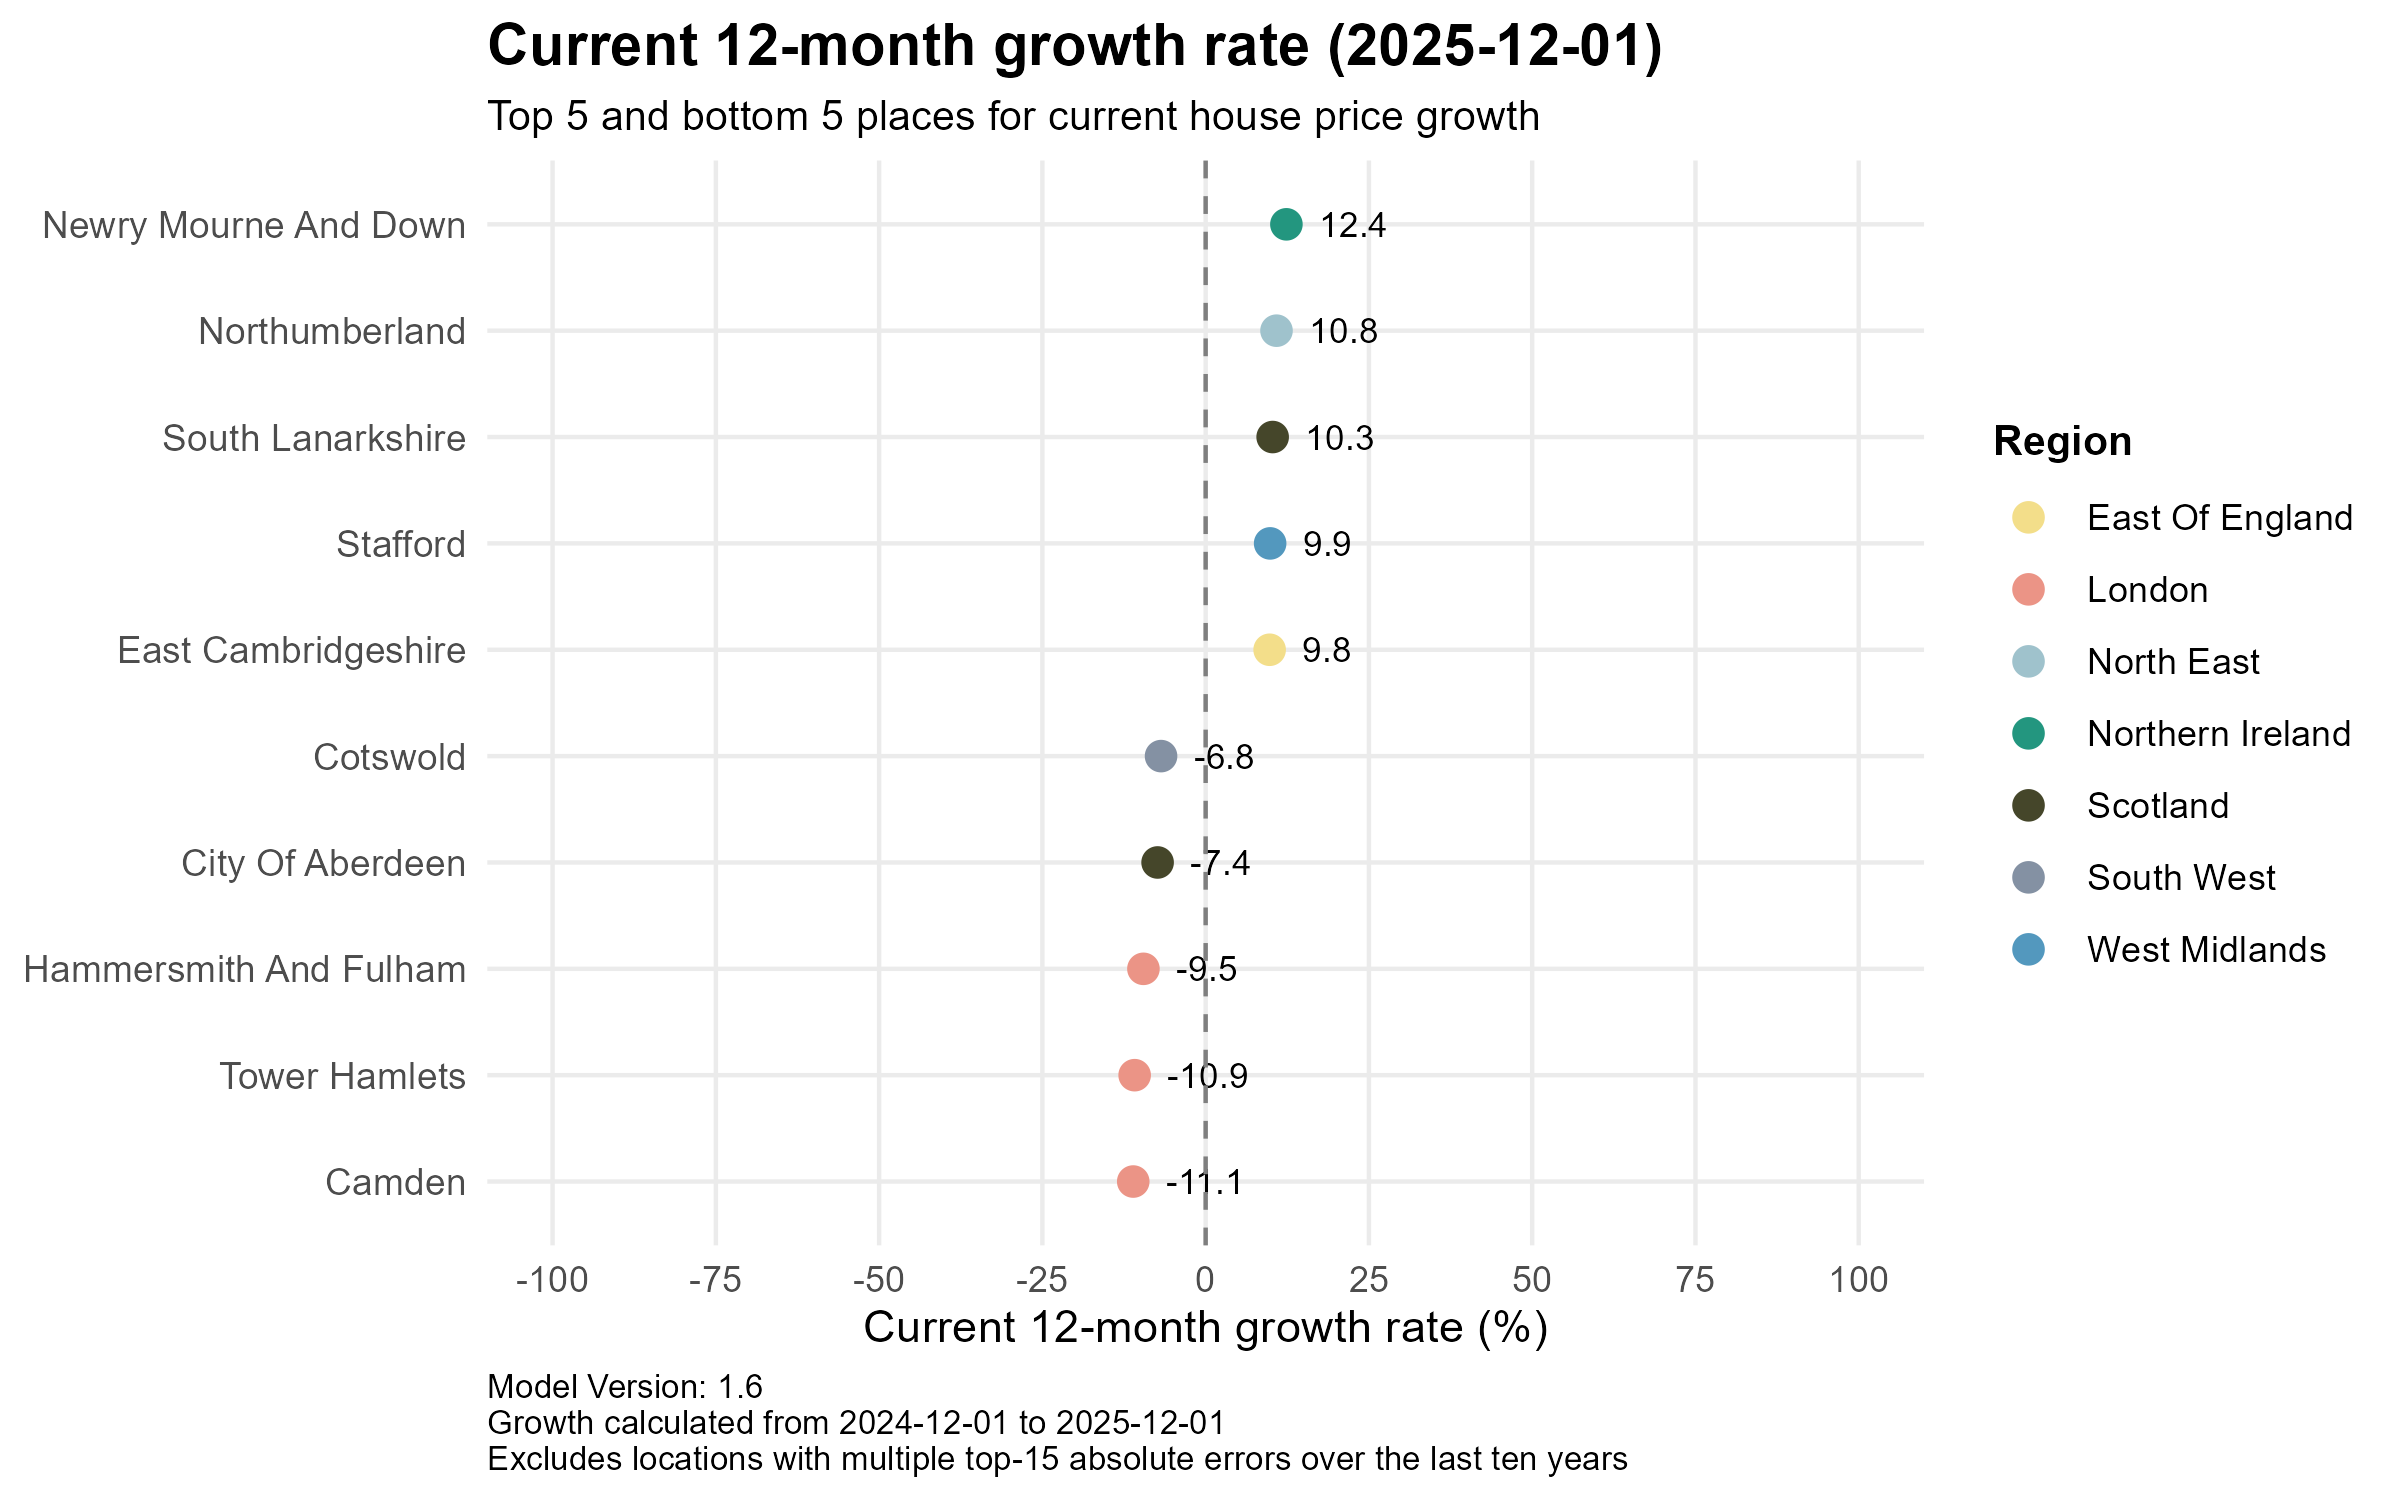
At the local level, current 12-month growth (to 2025-12-01) is sharply polarised. The strongest performers are Newry, Mourne & Down (+12.4%), Northumberland (+10.8%), South Lanarkshire (+10.3%), Stafford (+9.9%) and East Cambridgeshire (+9.8%) – A mix of Northern Irish, Scottish and English authorities spread across several regions, suggesting the gains aren’t confined to a single market. The weakest are dominated by London boroughs: Camden (−11.1%), Tower Hamlets (−10.9%) and Hammersmith & Fulham (−9.5%) all posted double-digit declines, alongside the City of Aberdeen (−7.4%) and Cotswold (−6.8%). The gap between the best and worst is now over 23 percentage points.
Predictions
Overall
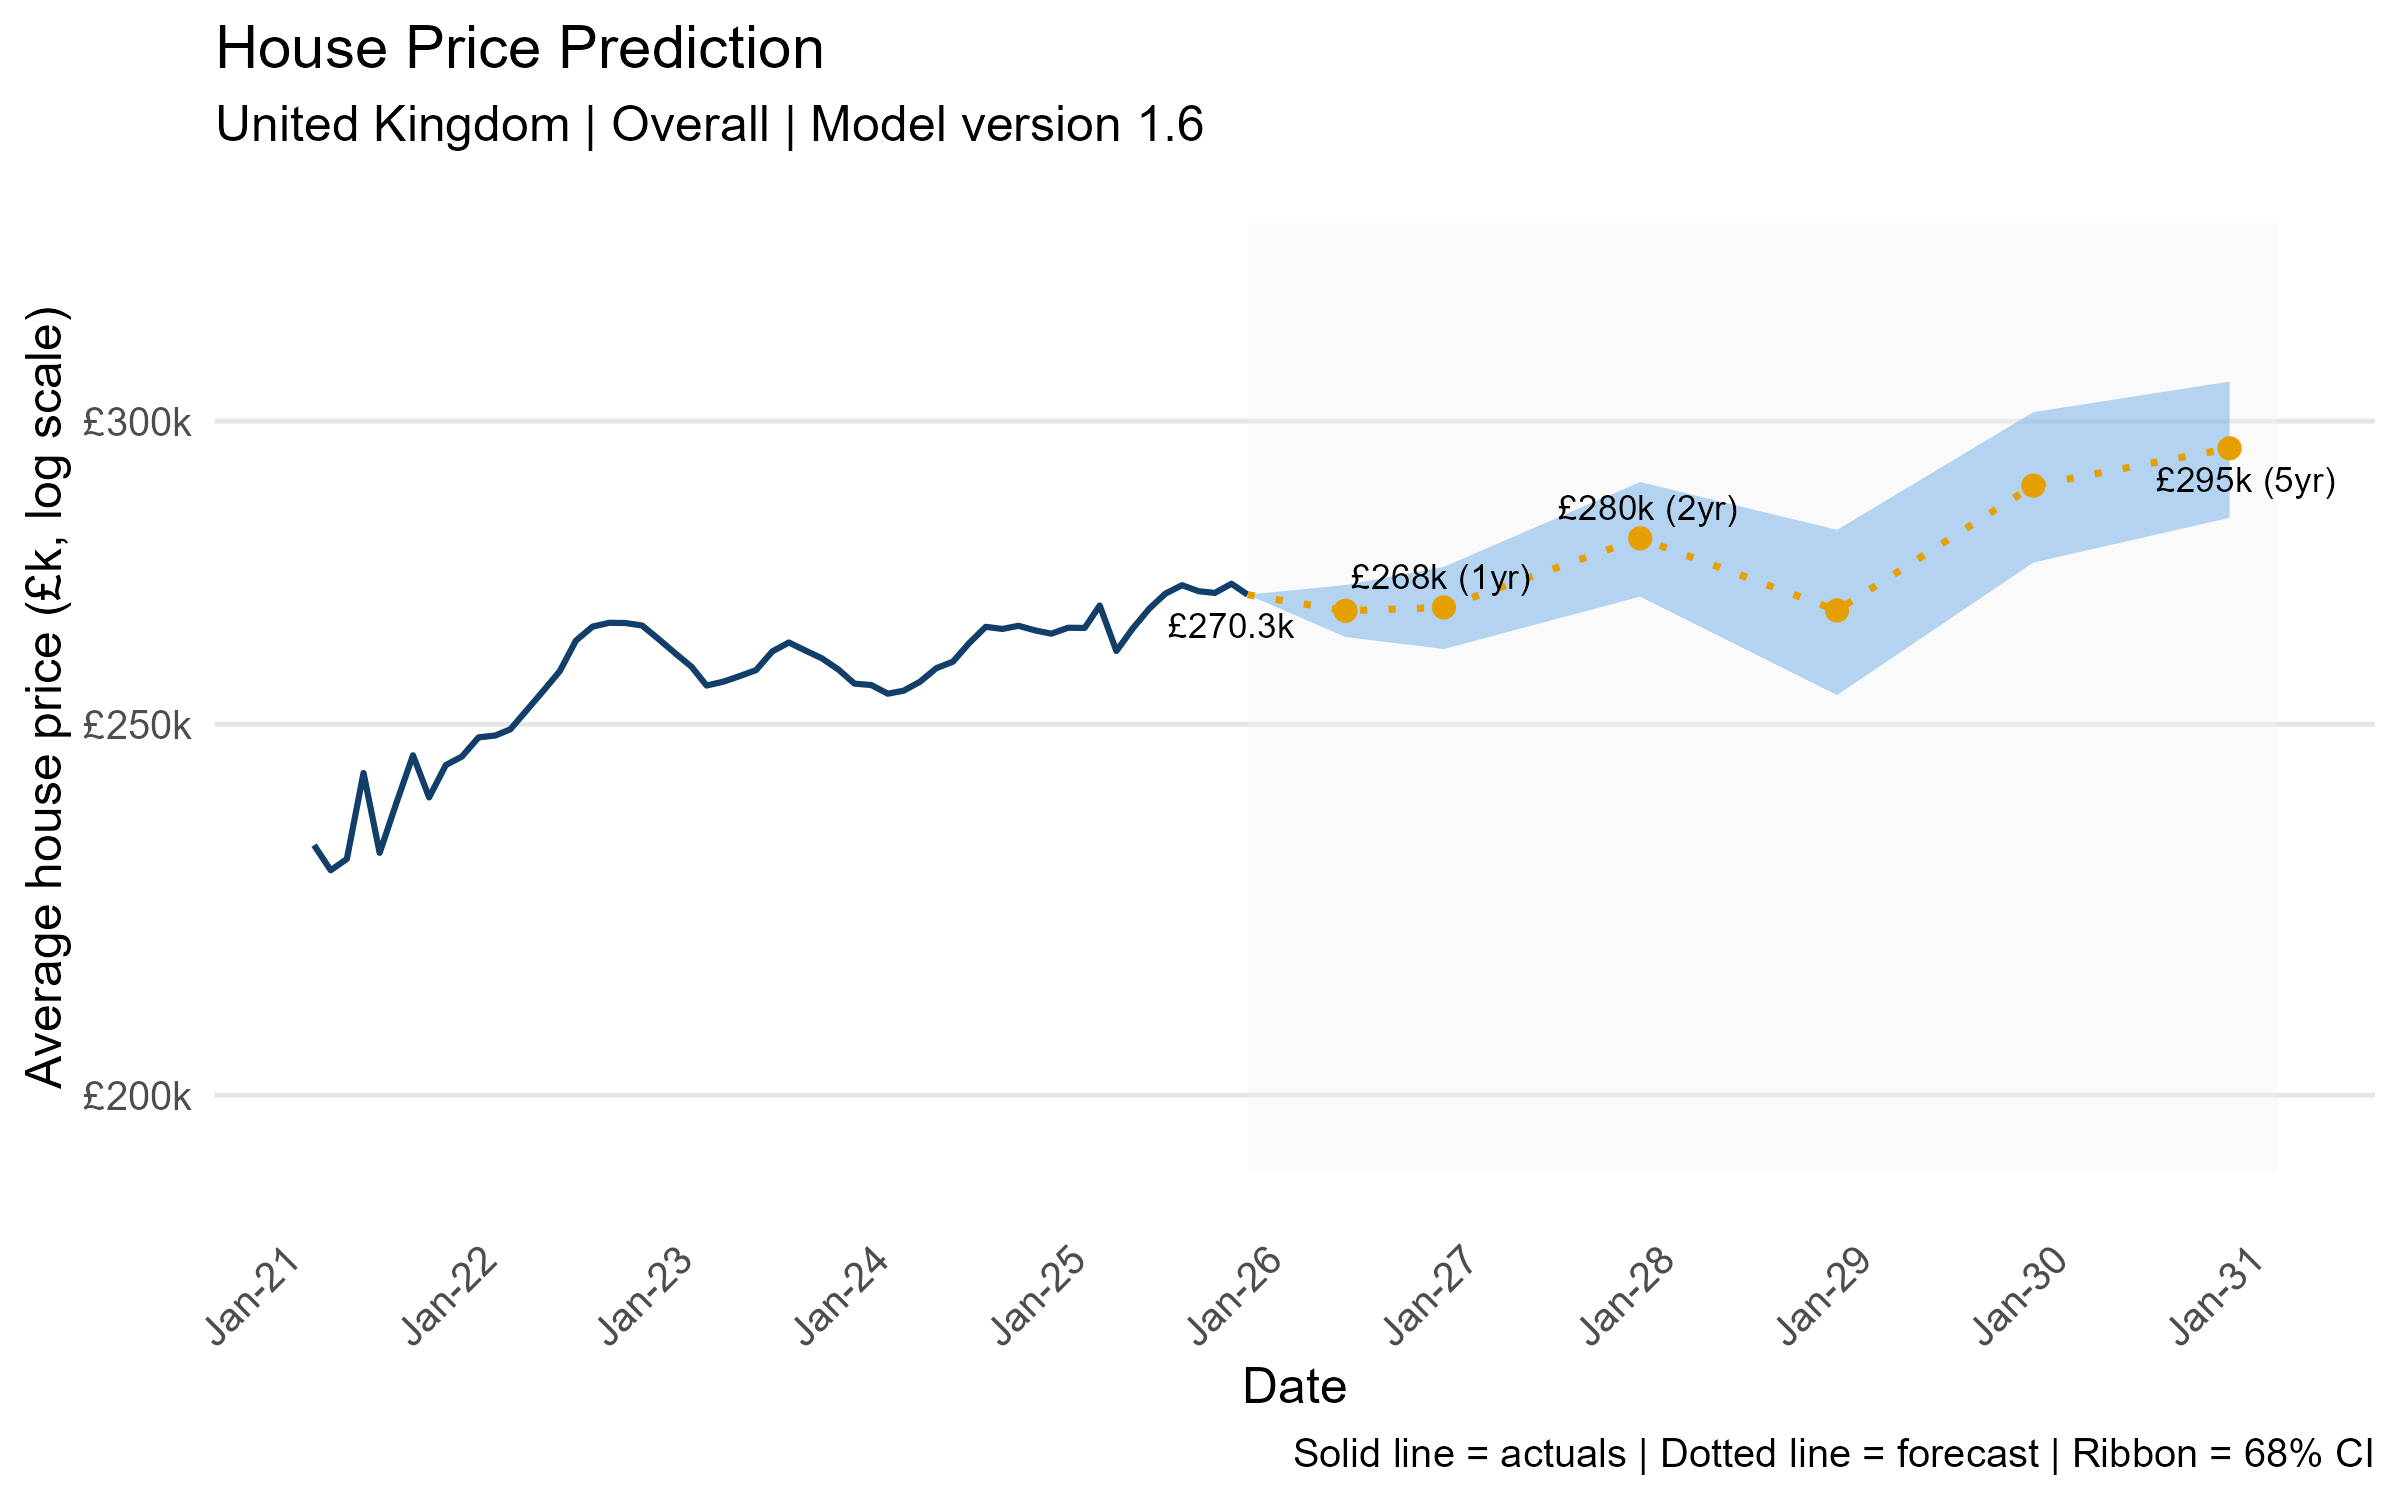
The forecast assumes a gentle recovery from about £270k (Dec-25) to ~£268k (1yr), ~£280k (2yr) and ~£295k (5yr), roughly +9% over five years (~2% p.a.), which is a fairly subdued growth path. Notably, the model expects a slight dip before prices regain momentum, and the widening confidence interval beyond 2028 highlights the increasing uncertainty at longer horizons.
Regional
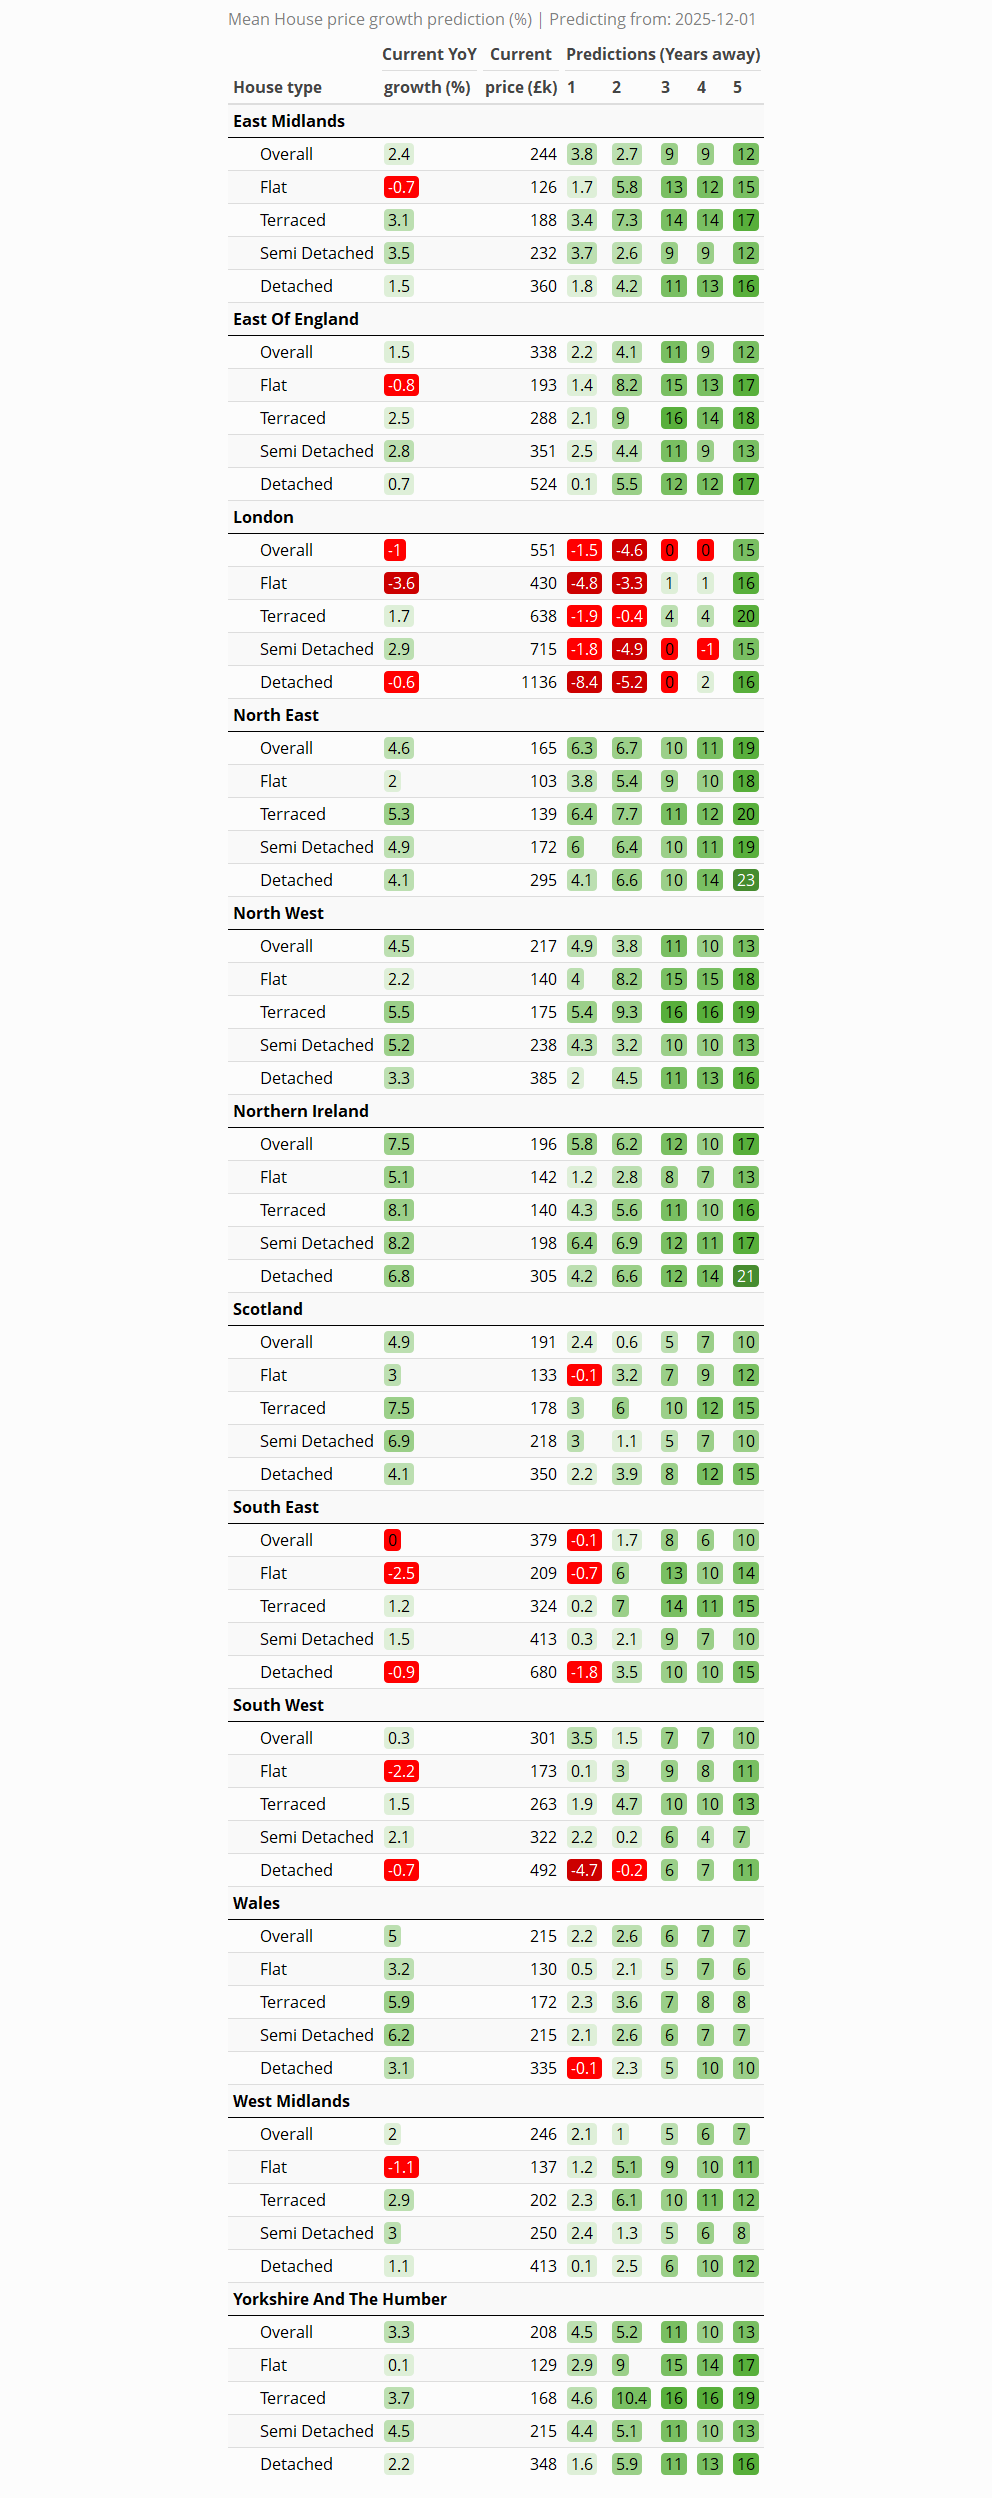
Short term (1 year): Most regions are forecast to grow around 2–6% over the next year, with the North East (6.3%), Northern Ireland (5.8%) and the North West (4.9%) leading the way. London is the clear outlier, with the model predicting a further 1.5% decline overall and sharper falls for flats (−4.8%) and detached homes (−8.4%).
Medium term (2–3 years): By two years, the majority of regions cluster around 3–6% cumulative growth, and by three years most sit in the 5–10% range — a broad-based but unspectacular recovery. London remains the laggard, still forecast to be down at the two-year mark (−4.6% overall) and only clawing back to roughly flat by year three, with detached properties particularly weak.
Long term (4–5 years): At the five-year horizon most regions converge toward 10–20% cumulative growth, led by the North East (19%), Yorkshire (13%) and Northern Ireland (17%). London eventually turns positive but trails significantly at around 15% overall, while Scotland (10%) and Wales (7%) also sit at the lower end — and across all regions, flats consistently underperform houses, suggesting the post-pandemic space premium persists.
Local
12-month prediction (to 2026-12-01)
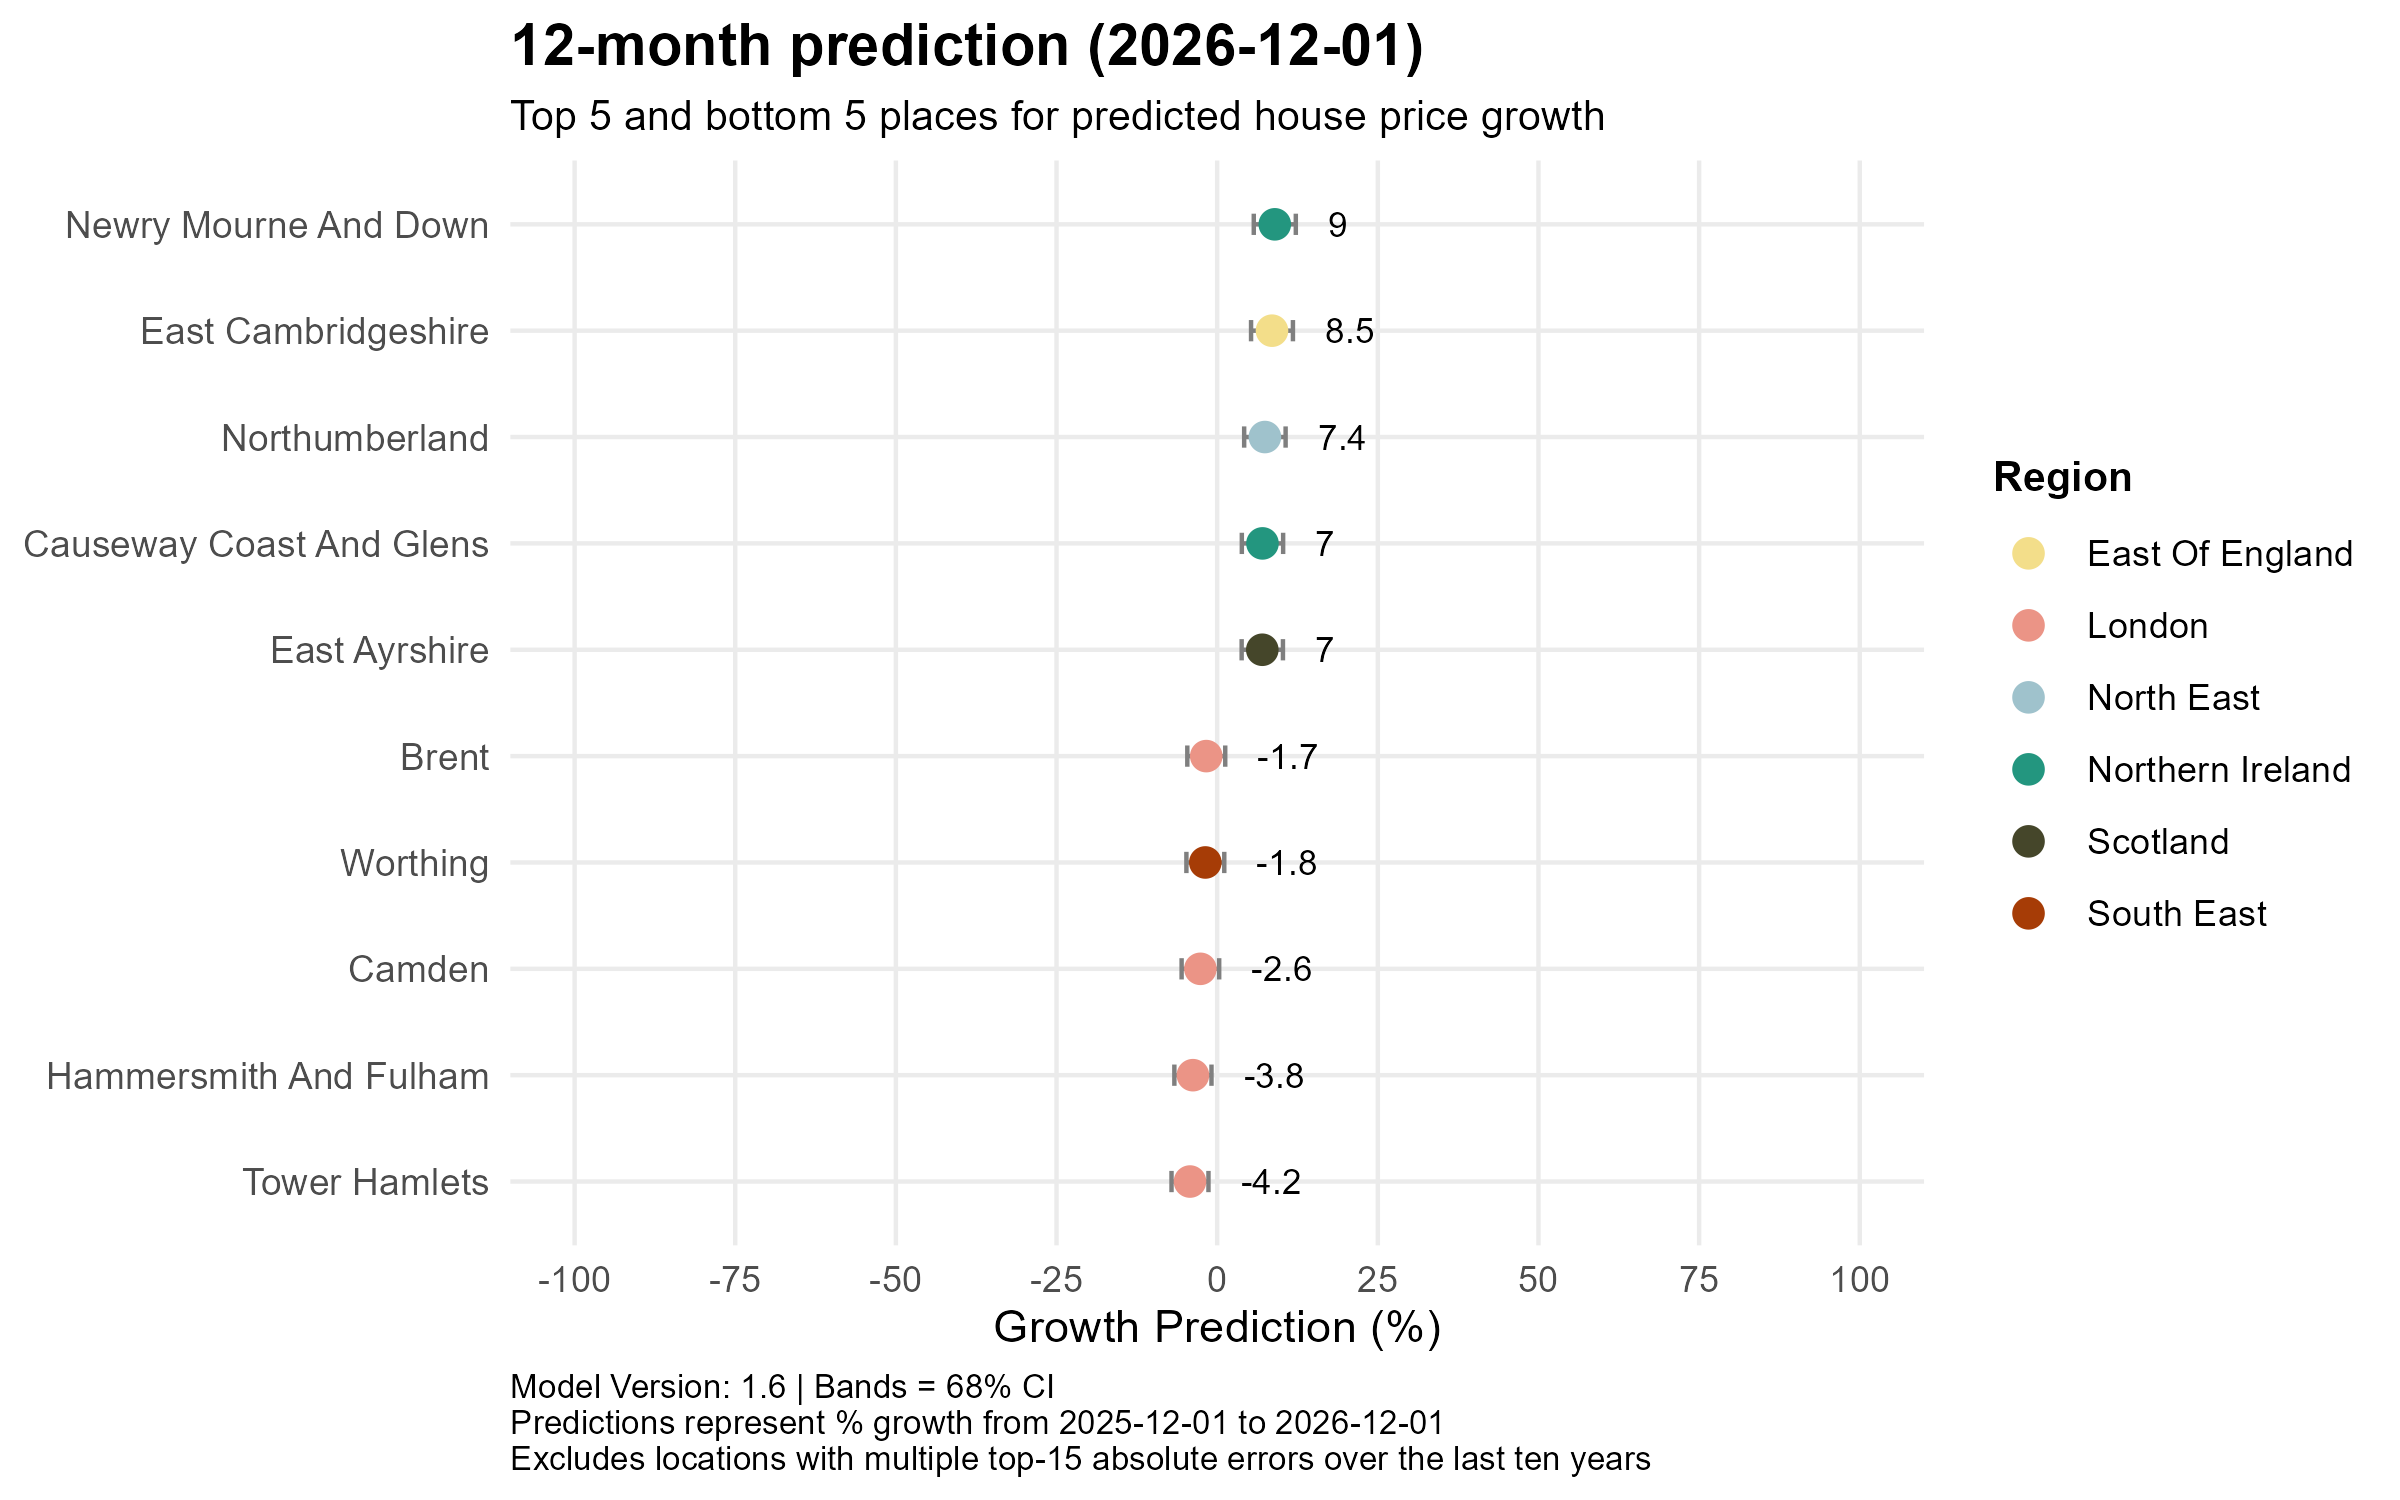
The strongest 1-year gains are concentrated in Northern Ireland and the North East — Newry, Mourne & Down leads at +9%, followed by East Cambridgeshire (East of England, +8.5%), Northumberland (North East, +7.4%), Causeway Coast & Glens (Northern Ireland, +7%) and East Ayrshire (Scotland, +7%). The weakest areas are overwhelmingly London boroughs: Tower Hamlets (−4.2%), Hammersmith & Fulham (−3.8%) and Camden (−2.6%), with Worthing (South East, −1.8%) the only non-London entry in the bottom five. The model is calling a sharp near-term split, with affordable northern and devolved-nation markets pulling further ahead while parts of London continue to correct.
24-month prediction (to 2027-12-01)
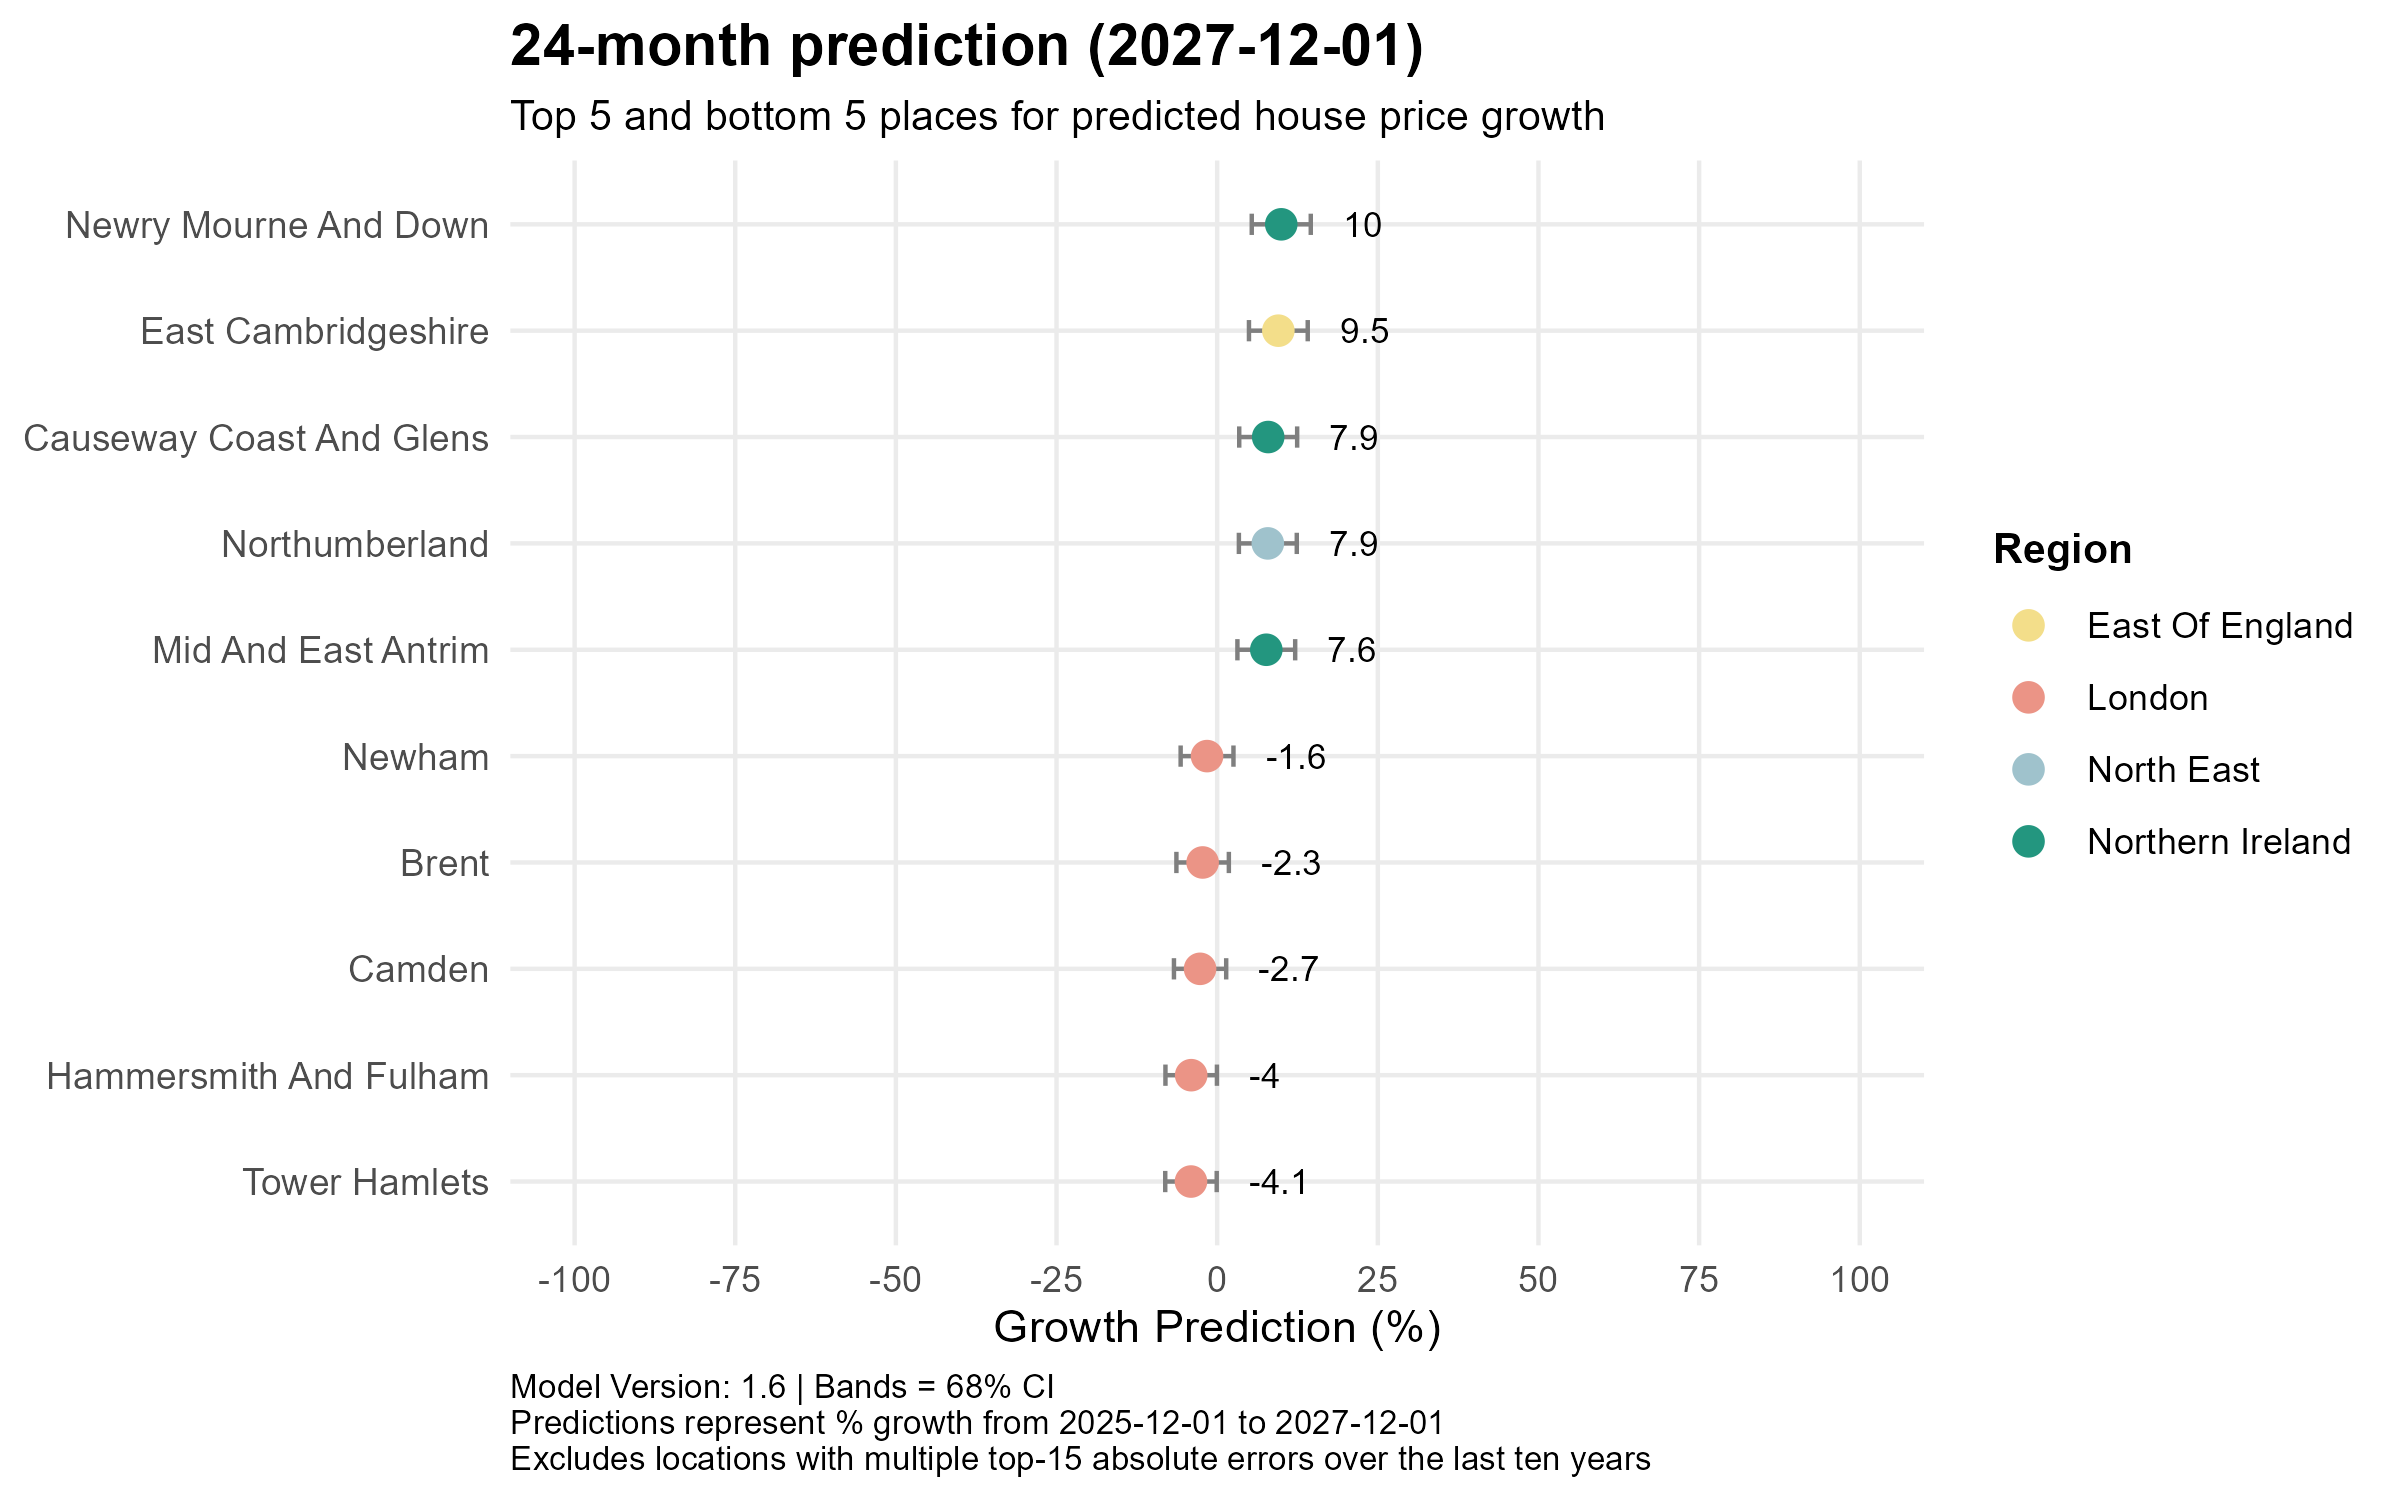
At two years, the top five are dominated by Northern Ireland — Newry, Mourne & Down (+10%), Causeway Coast & Glens (+7.9%) and Mid & East Antrim (+7.6%) all feature, alongside East Cambridgeshire (East of England, +9.5%) and Northumberland (North East, +7.9%). The bottom five are now exclusively London: Tower Hamlets (−4.1%), Hammersmith & Fulham (−4%), Camden (−2.7%), Brent (−2.3%) and Newham (−1.6%). The model expects persistent underperformance in specific London boroughs even over two years, while Northern Irish authorities continue to dominate the leaderboard.
60-month prediction (to 2030-12-01)
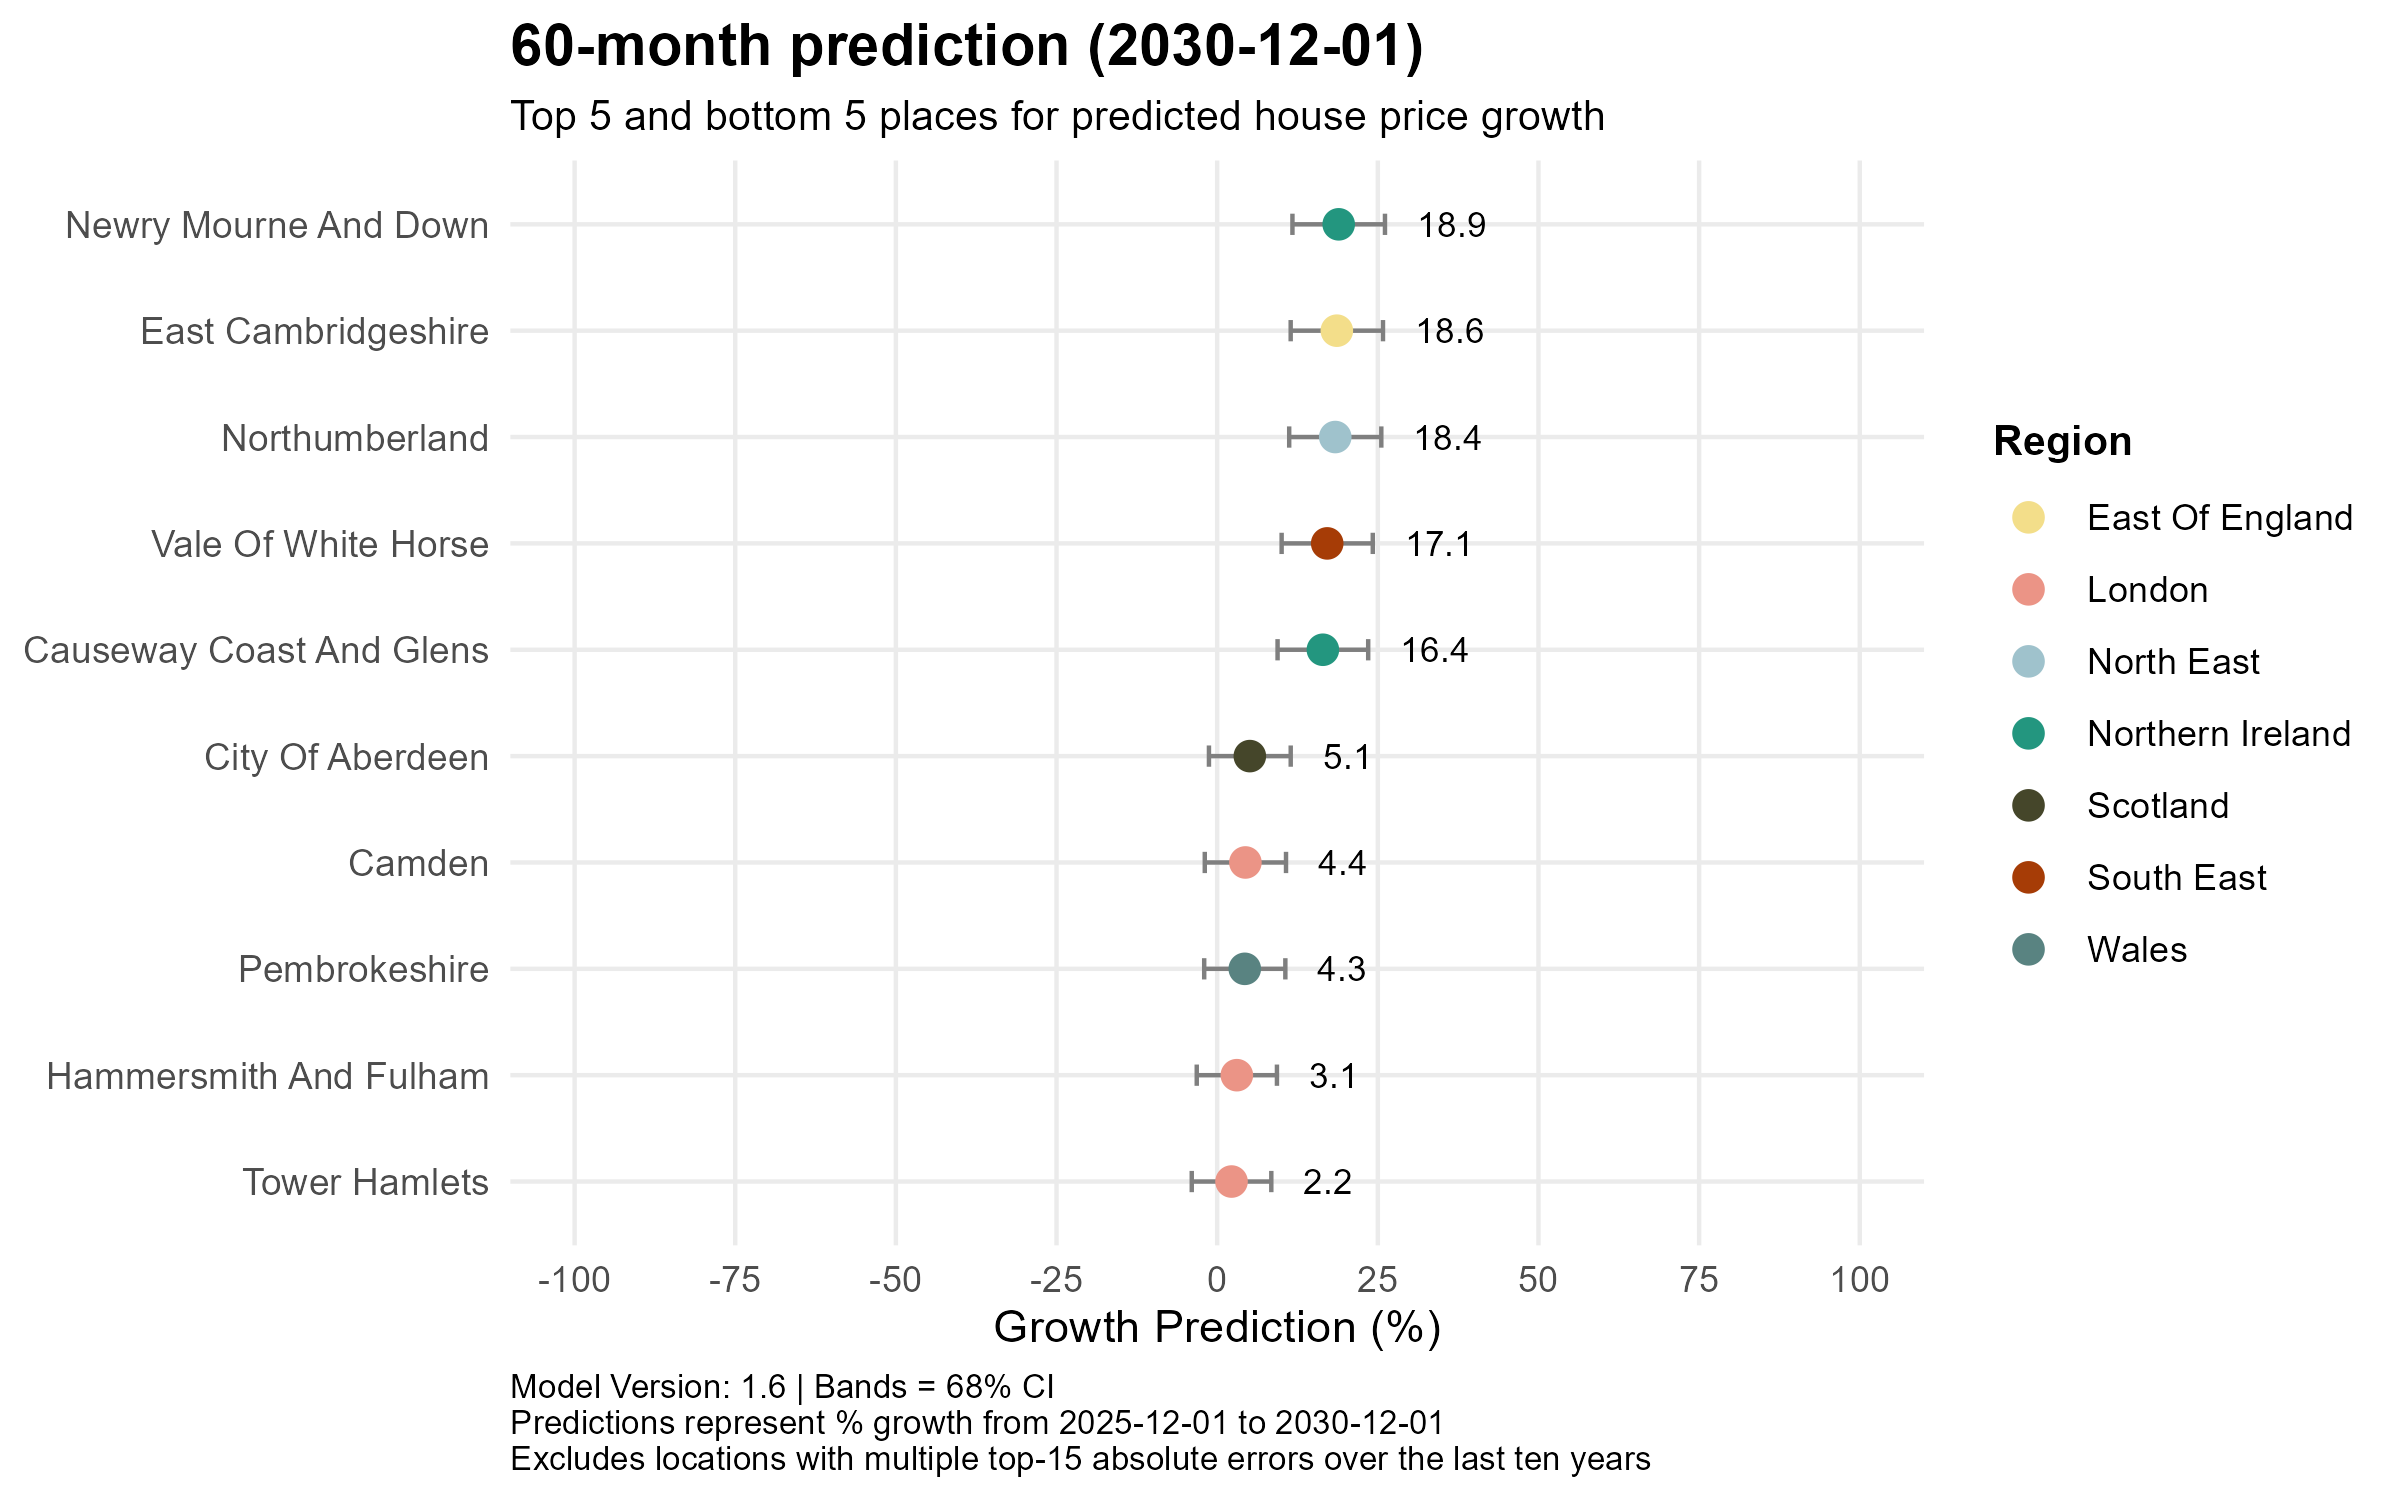
By five years the leaders rotate slightly — Newry, Mourne & Down (Northern Ireland, +18.9%), East Cambridgeshire (East of England, +18.6%) and Northumberland (North East, +18.4%) hold their positions, but Vale of White Horse (South East, +17.1%) enters the top five, suggesting some long-run resilience in parts of the South East. The laggards are now all positive but trail significantly: Tower Hamlets (London, +2.2%), Hammersmith & Fulham (London, +3.1%), Pembrokeshire (Wales, +4.3%), Camden (London, +4.4%) and City of Aberdeen (Scotland, +5.1%). Across all three horizons, Newry, Mourne & Down and East Cambridgeshire appear consistently at the top, while Tower Hamlets and Hammersmith & Fulham repeatedly anchor the bottom — a remarkably stable pattern.
The overall picture is one of moderate, broad-based recovery, not a boom, with average UK prices forecast to edge up roughly 2% a year over the next five years. The dominant theme remains a north–south and affordability-driven split: cheaper, more affordable regions like Northern Ireland, the North East and parts of Scotland continue to outperform, while London, particularly its flat-heavy boroughs faces a prolonged period of underperformance before eventually returning to modest positive growth. Rate cuts, when they come, should provide a tailwind, but with unemployment rising and household incomes under pressure, the model sees no catalyst for a sharp acceleration. As always, these are model outputs, not certainties. The widening confidence intervals at longer horizons are a useful reminder that the further out you look, the less anyone really knows.
