Economic summary
News
The UK economy stayed on fragile footing through June. Inflation, as measured by the Consumer Prices Index, held at 2.8% in the 12 months to May, unchanged from April and its lowest since March 2025, though services inflation climbed to 3.7%, the gauge the Bank watches most closely. With a US–Iran ceasefire easing energy prices, the Bank of England held Bank Rate at 3.75% for a fourth consecutive meeting on 18 June, voting 7–2 as two members pressed for a rise to 4%. Momentum stayed weak, however, with monthly GDP down 0.1% in April and the composite PMI slipping into contraction in May for the first time in over a year.
ONS Revisions
Before we begin, a note on this month’s figures. The ONS has substantially revised its house-price series. Its latest release reports that UK prices rose 3.8% in the year to April 2026, the strongest annual rate since March 2025, up sharply from a revised estimate of 0.0% in the 12 months to March. Much of that jump is a base effect: prices fell 2.9% in April 2025 around the Stamp Duty changes, flattering this year’s annual comparison. Because our model is built on this revised ONS data, several of the growth figures below look markedly different from previous months, and month-to-month comparisons with earlier posts should be treated with caution.
Indicators
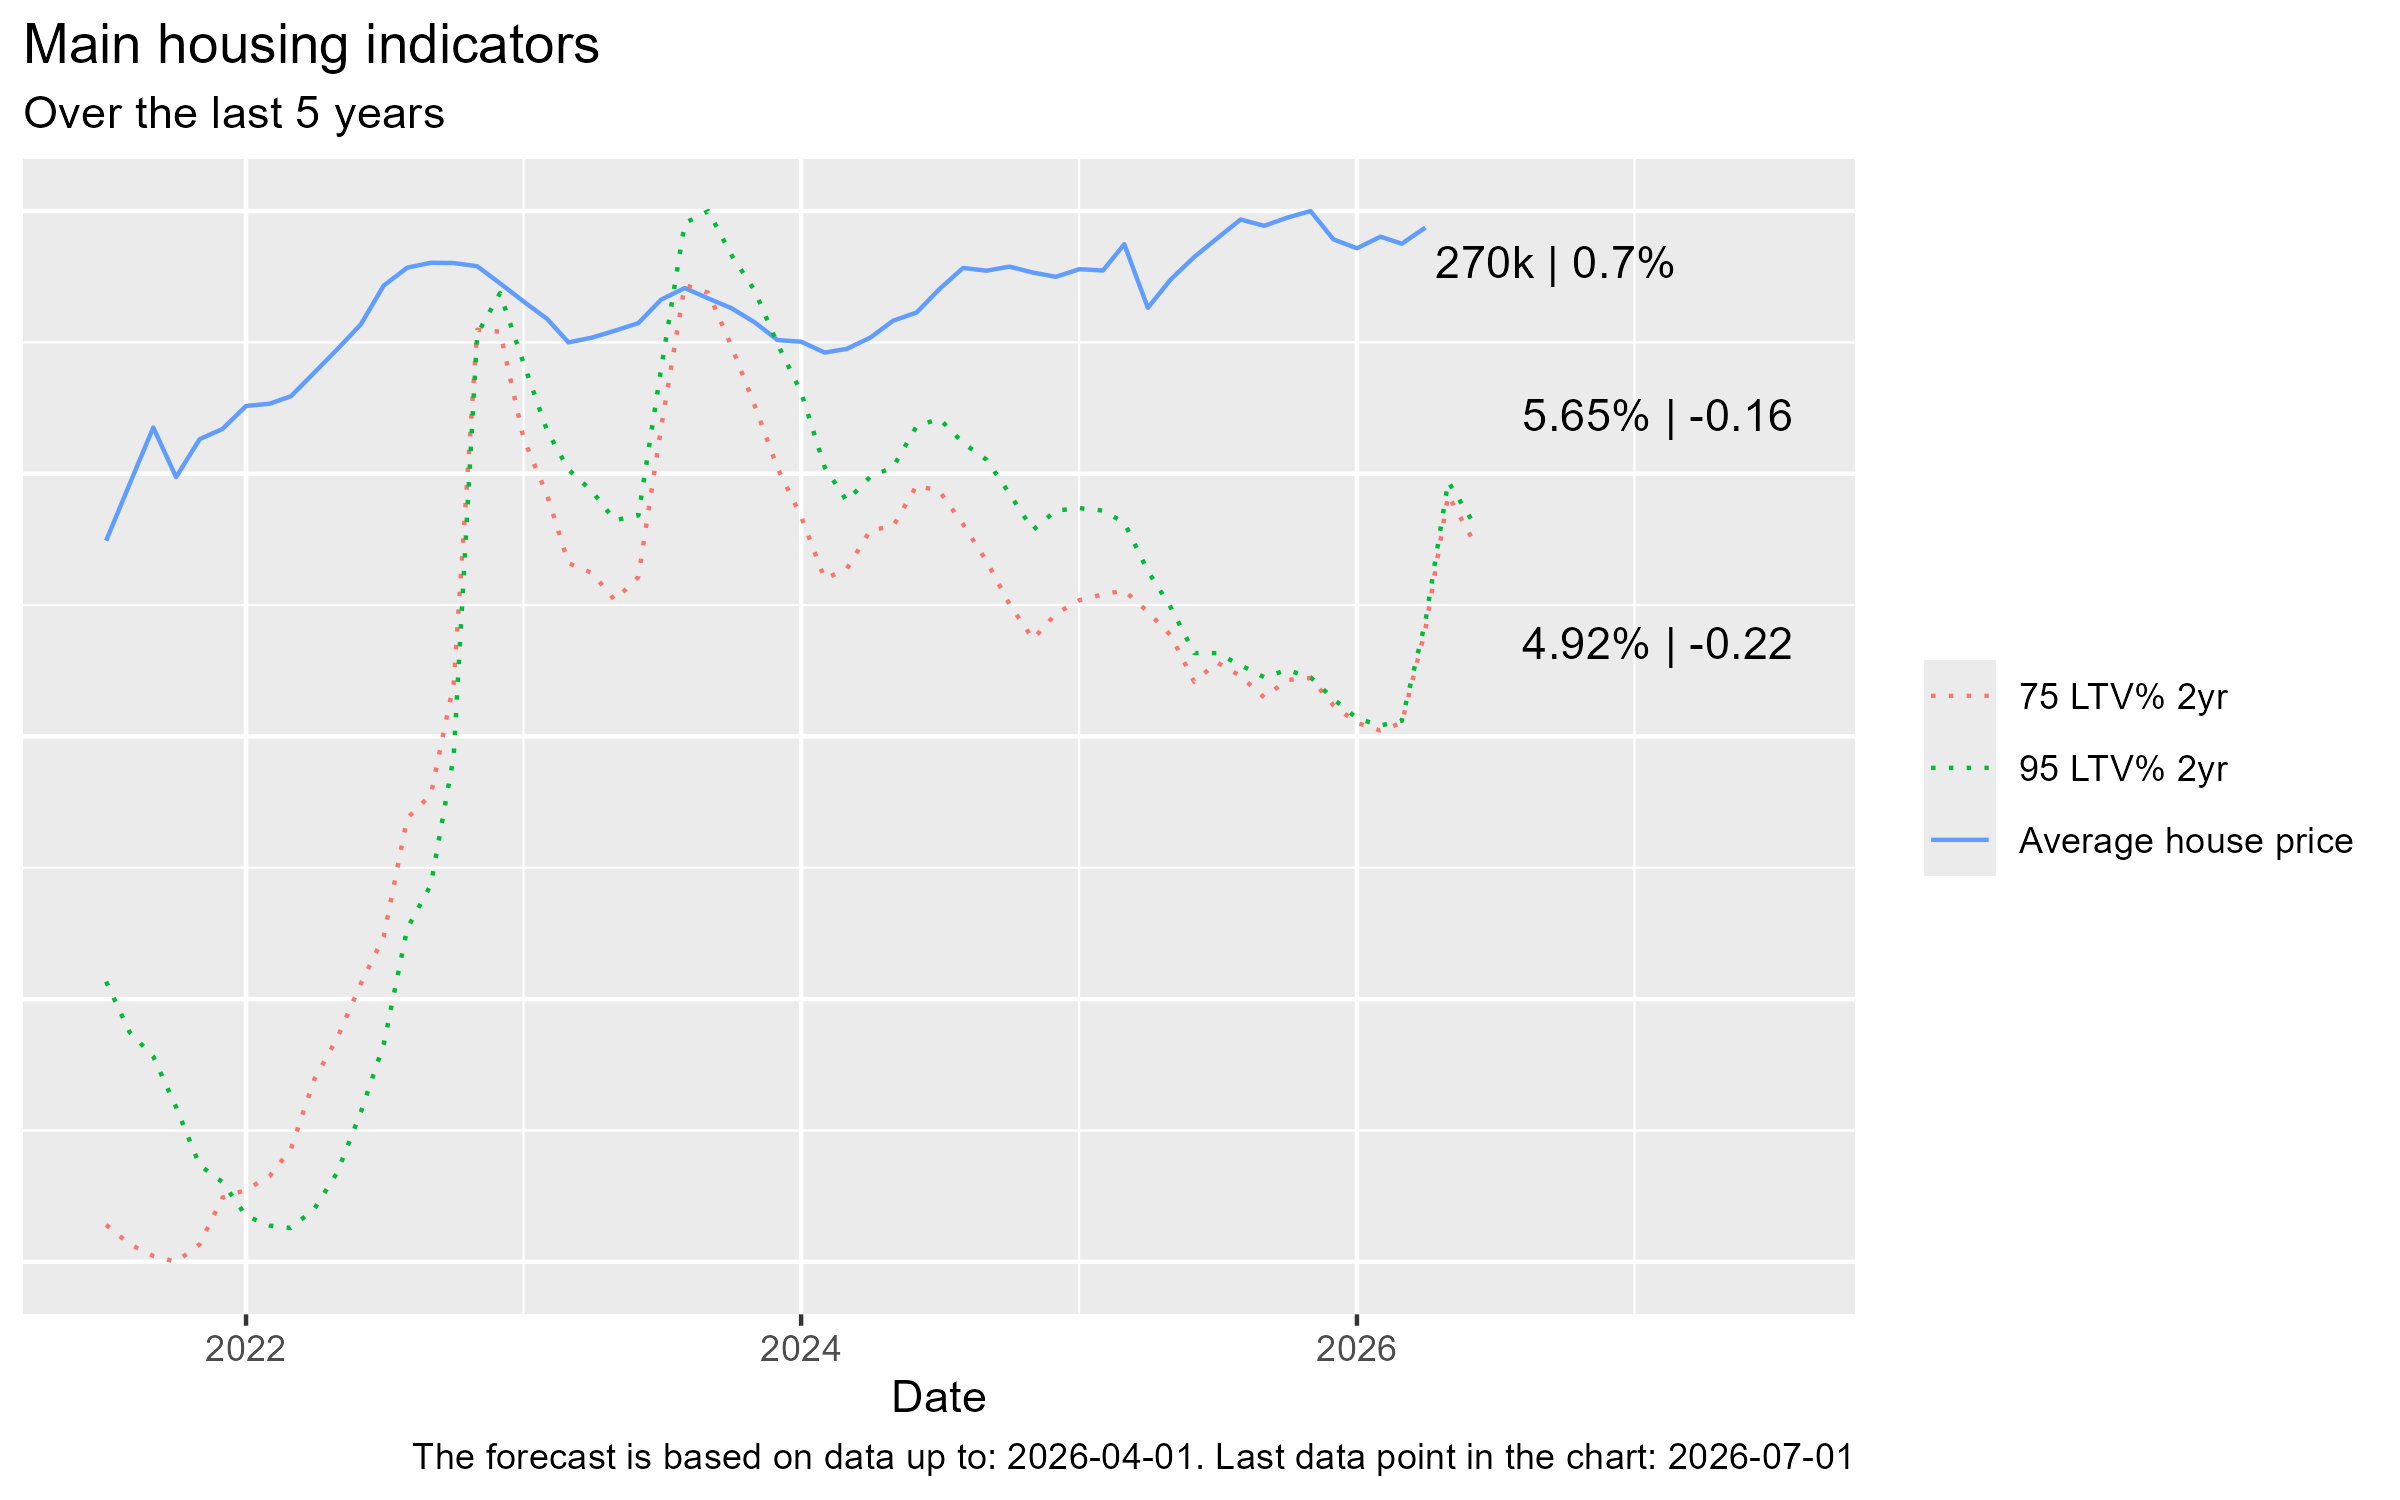
- Average house prices rose to £270k, up 0.7% on the previous month
- The average 75% LTV 2-year mortgage rate stood at 4.92% and the 95% LTV 2-year rate at 5.65% — both a touch lower at the latest reading (−0.22 and −0.16 respectively) but well above their spring lows after the energy-driven jump in gilt yields
Current growth rates
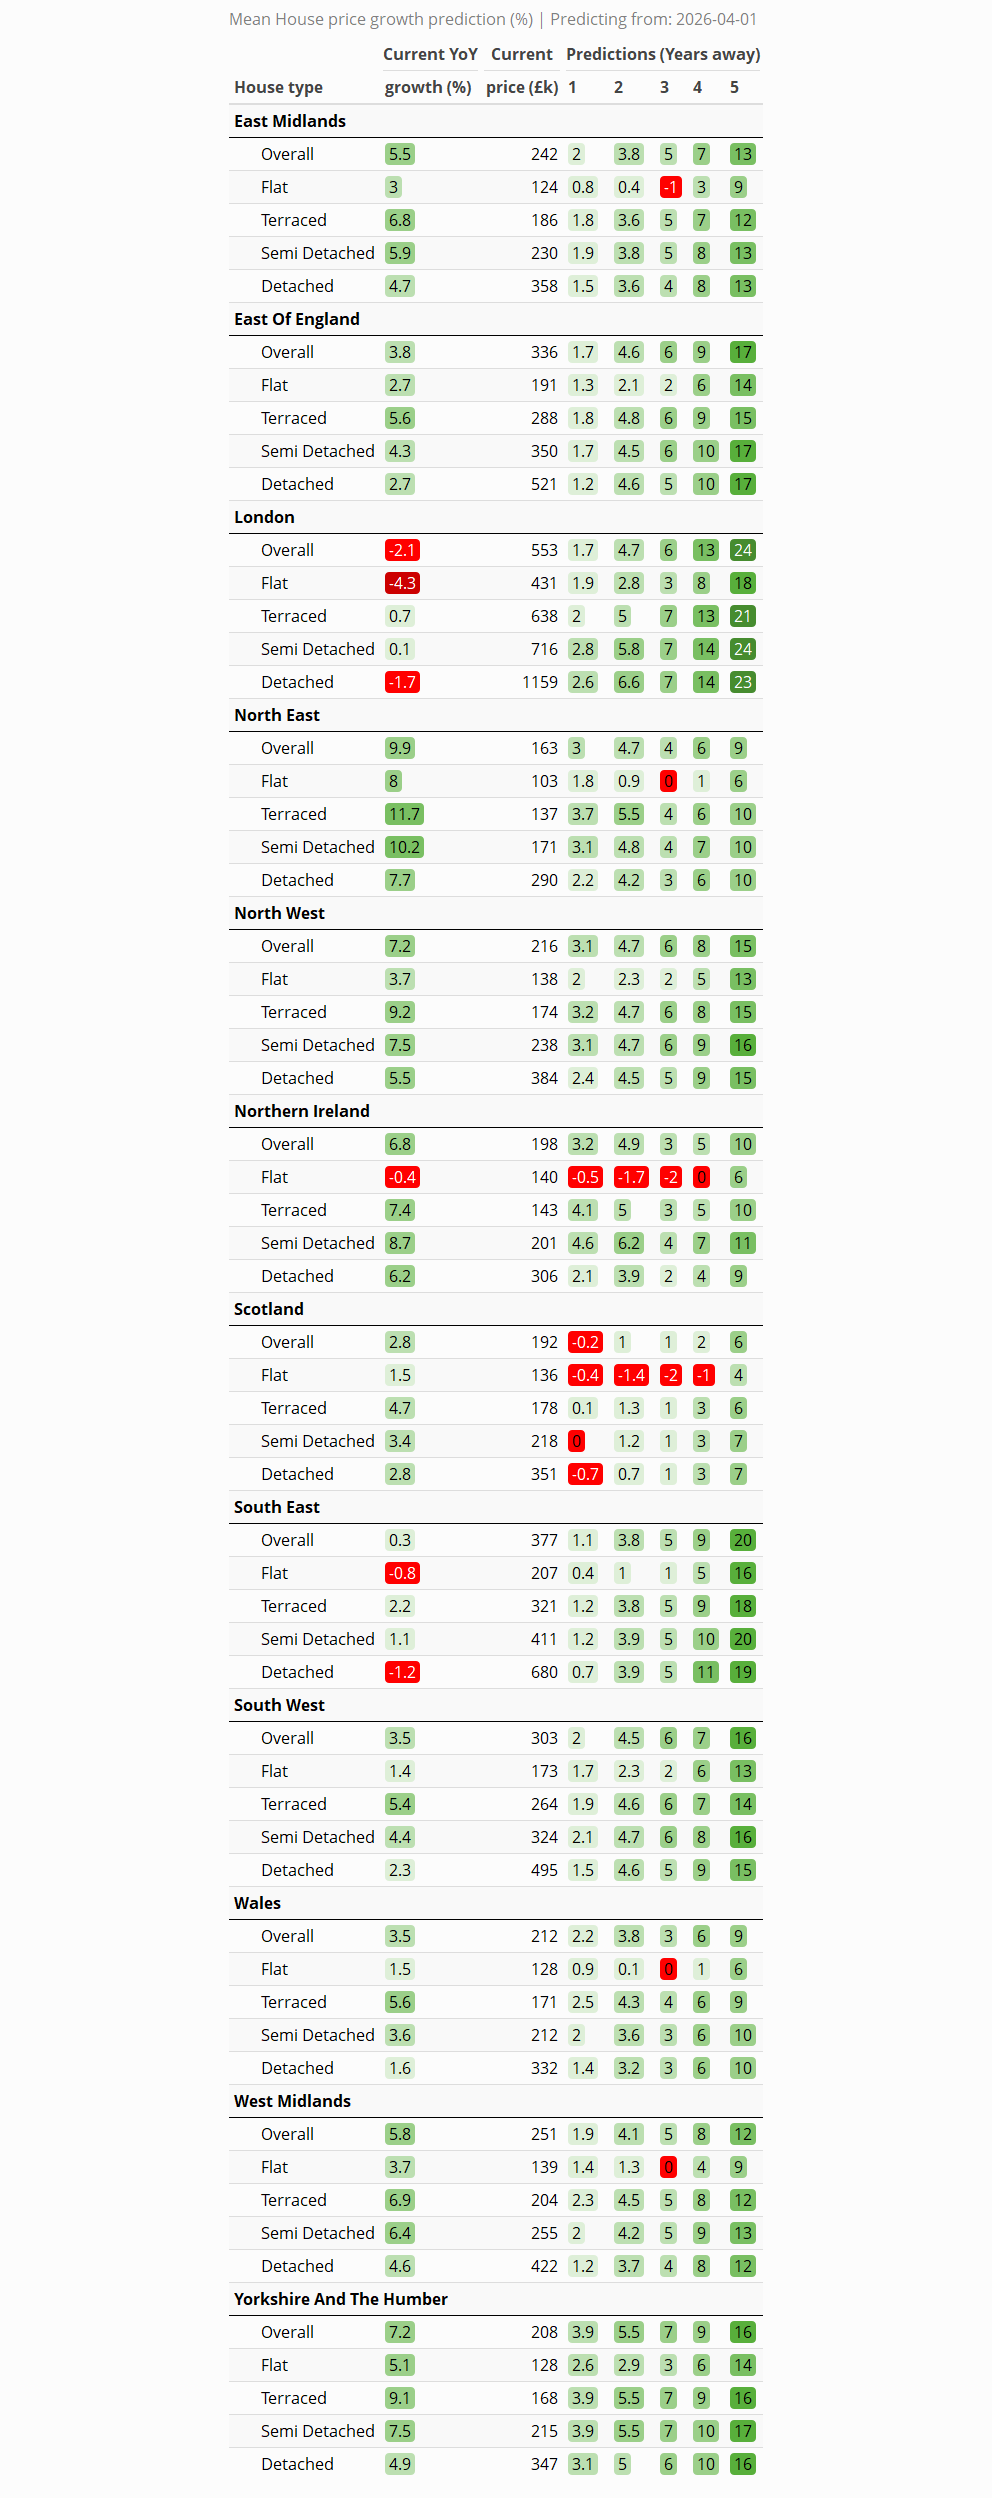
Across the regions, the revised data confirms a stark north–south split. The North East now leads the UK with annual growth of +9.9%, followed by the North West and Yorkshire and The Humber (both +7.2%) and Northern Ireland (+6.8%), with the West Midlands (+5.8%) and East Midlands (+5.5%) close behind. London remains the clear outlier, down −2.1% over the year, while the South East (+0.3%) is barely positive and Scotland (+2.8%), Wales (+3.5%) and the South West (+3.5%) sit in the middle of the pack. The familiar pattern holds: affordability pressure continues to bite hardest in the higher-priced southern markets.
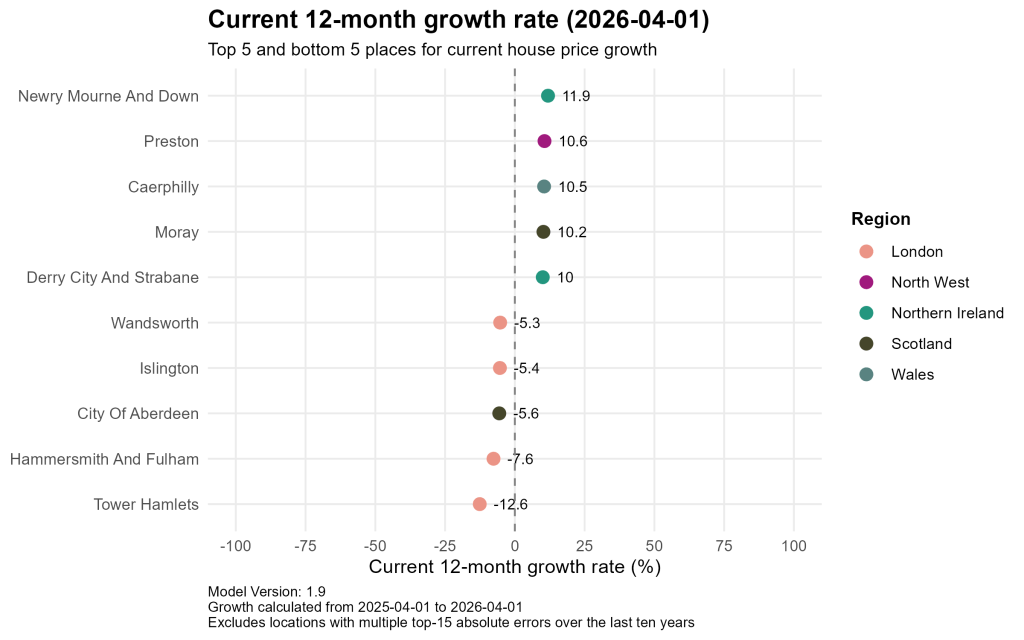
At the local level the divergence is even sharper. Newry Mourne and Down in Northern Ireland leads the country with 12-month growth of +11.9%, followed by Preston in the North West (+10.6%), Caerphilly in Wales (+10.5%), Moray in Scotland (+10.2%) and Derry City and Strabane in Northern Ireland (+10.0%) — a top five drawn entirely from more affordable northern, Welsh and Irish markets. London dominates the other end: Tower Hamlets has fallen −12.6% over the year, with Hammersmith and Fulham (−7.6%), Islington (−5.4%) and Wandsworth (−5.3%) also sharply down, joined by City of Aberdeen in Scotland (−5.6%). The scale of these swings underlines just how unevenly the market is moving.
Predictions
Overall
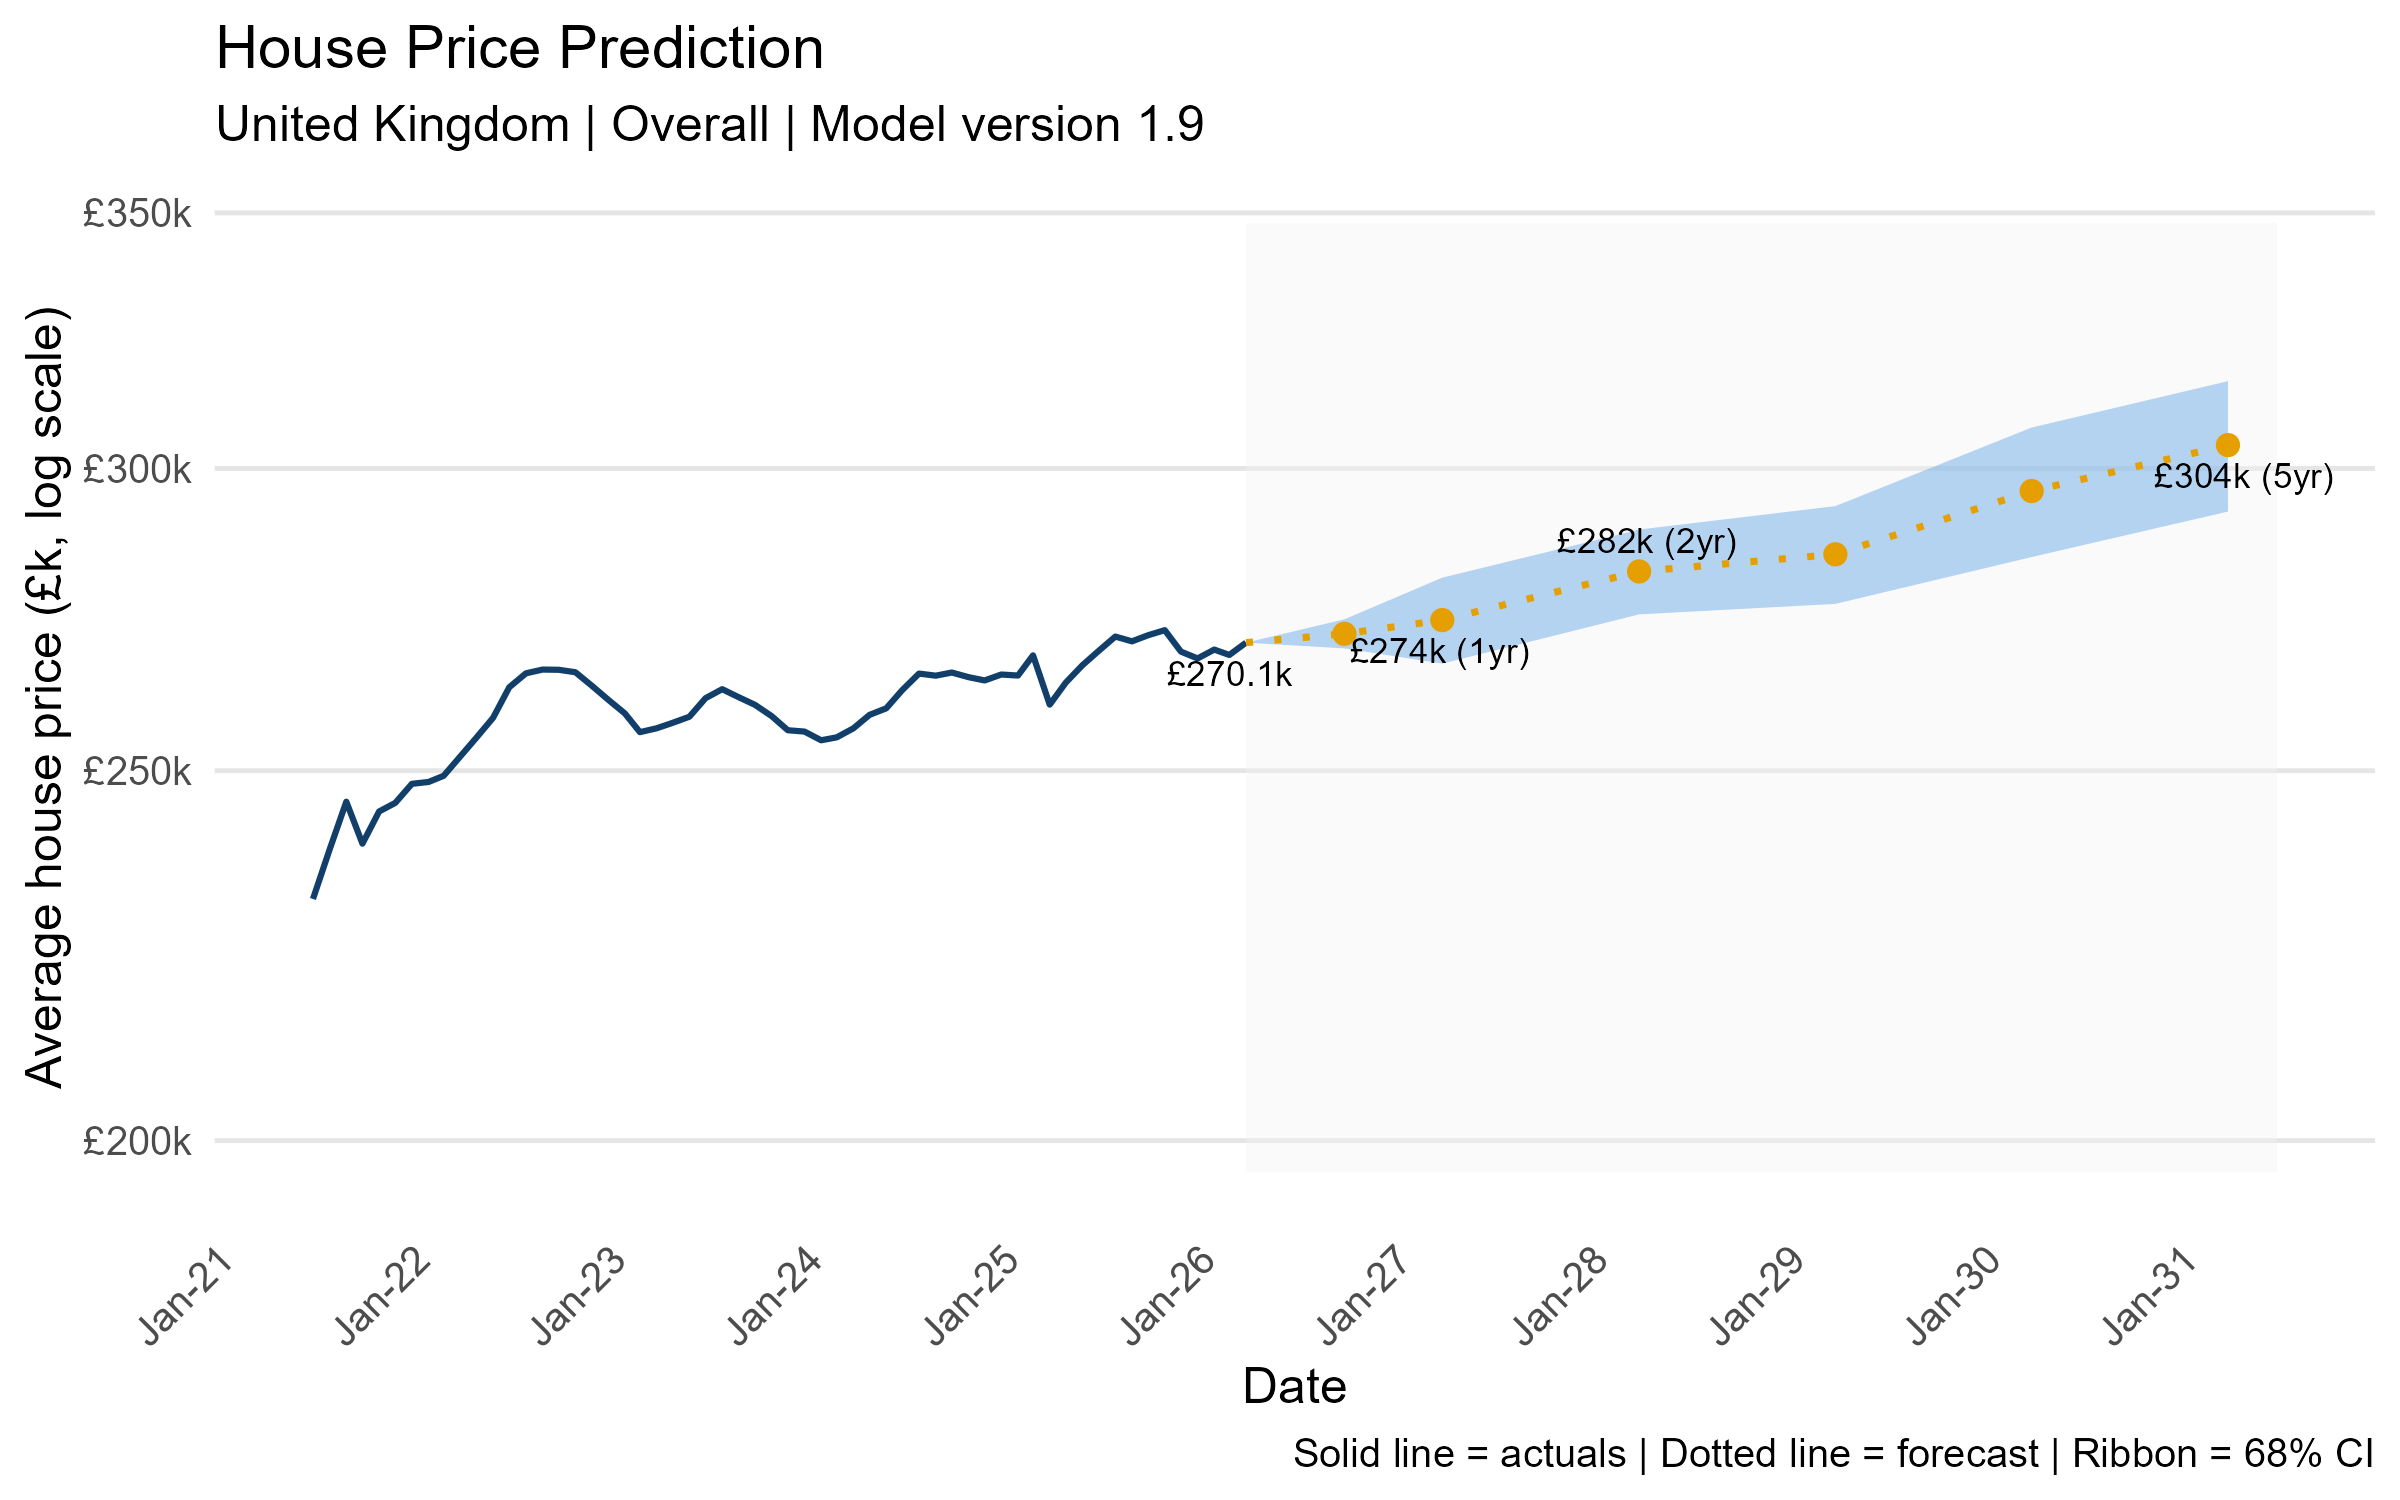
The model projects steady growth from the current £270.1k, rising to £274k within a year, £282k by 2028 and around £304k by 2031, cumulative growth of roughly 13% over five years. The widening confidence band beyond the two-year horizon reflects the genuine uncertainty in the energy and geopolitical outlook.
Regional
Short term (years 1–2): In year one, growth is positive across almost every region, led by Yorkshire and The Humber (+3.9%), Northern Ireland (+3.2%), the North West (+3.1%) and the North East (+3.0%), with Scotland the only region in negative territory at −0.2%. By year two the gains broaden to a cumulative +5% or so across Yorkshire (+5.5%), Northern Ireland (+4.9%) and London, the North West and the North East (all +4.7%), while Scotland continues to lag at +1%.
Medium term (years 3–4): Through years three and four London stages a marked turnaround, accelerating to +6% cumulative by year three and +13% by year four — comfortably the strongest four-year gain of any region. The East of England, Yorkshire and the South East (all around +9%) and the North West (+8%) follow, whereas Scotland (+2%) and the North East (+6%) bring up the rear.
Long term (year 5): Over the full five years the ranking inverts relative to recent editions: London tops the table at +24%, ahead of the South East (+20%), the East of England (+17%), Yorkshire and The Humber (+16%) and the South West (+16%). The affordable markets that led early on settle mid-table — the North West (+15%) and East Midlands (+13%) — while Scotland (+6%), the North East (+9%), Wales (+9%) and Northern Ireland (+10%) now trail the field.
Local
12-month prediction (to April 2027)
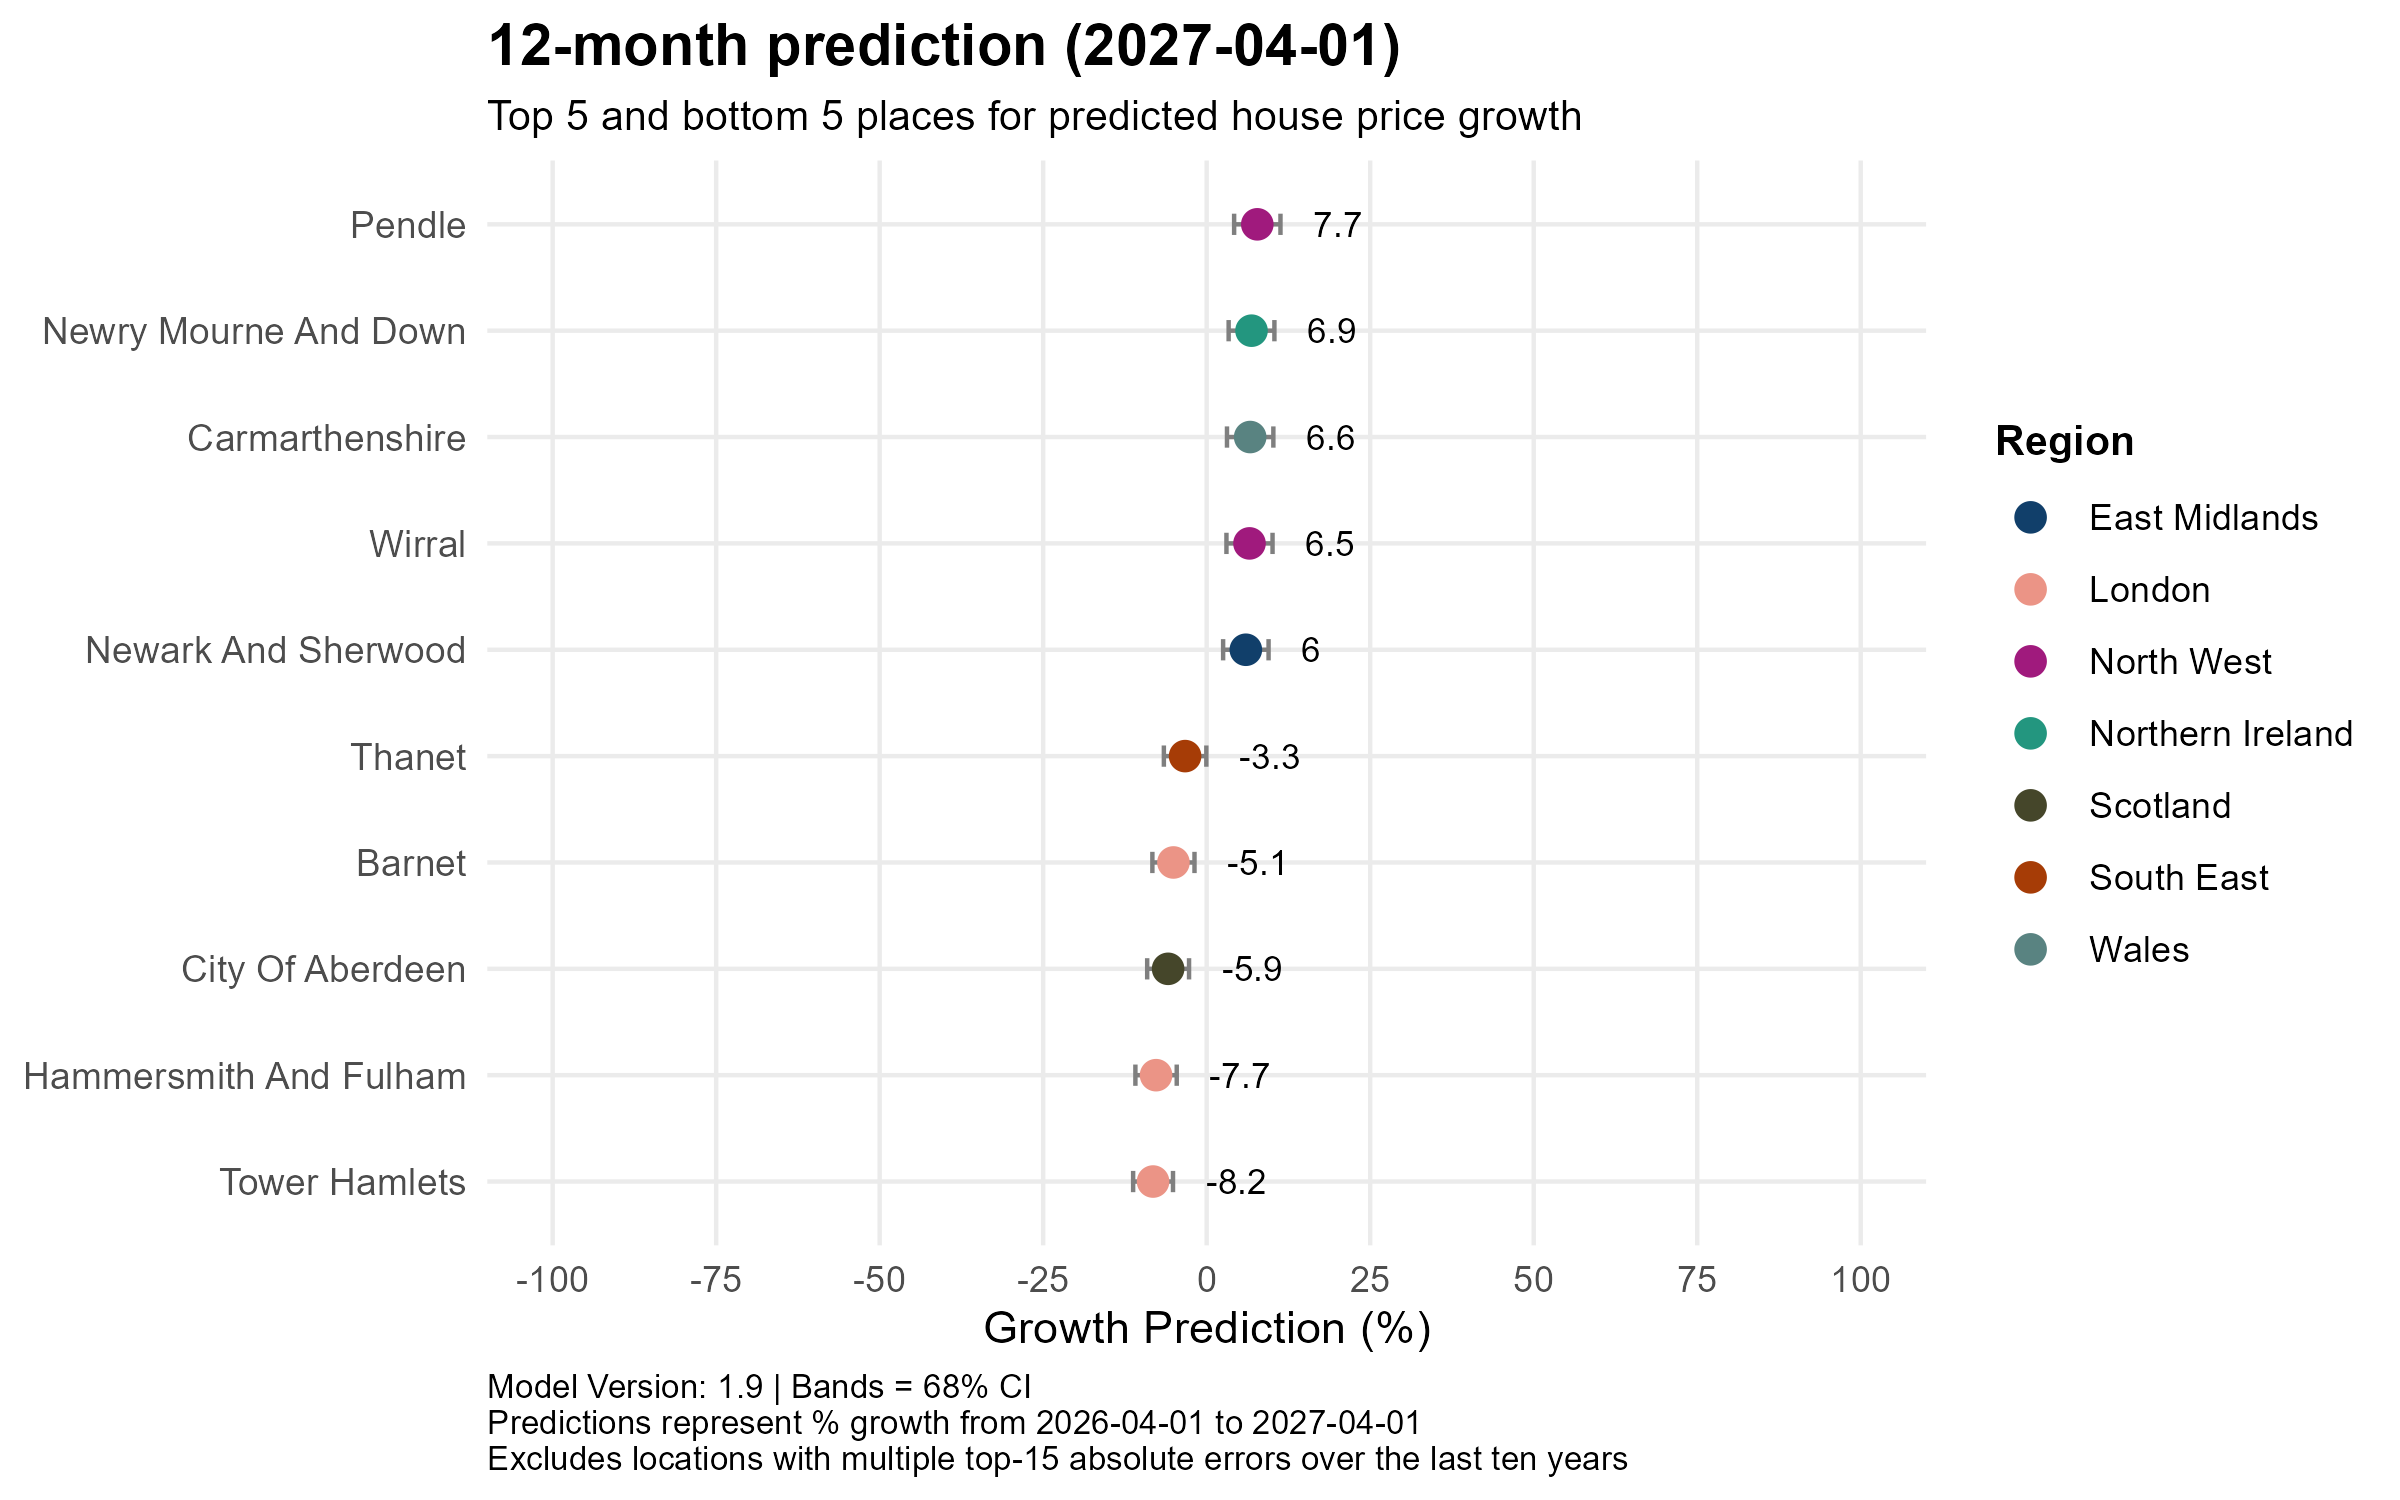
In the near term the affordable North and West still dominate the top of the table, with Pendle in the North West leading at +7.7%, followed by Newry Mourne and Down in Northern Ireland (+6.9%), Carmarthenshire in Wales (+6.6%), Wirral in the North West (+6.5%) and Newark and Sherwood in the East Midlands (+6.0%). The weakest forecasts remain concentrated in London, where Tower Hamlets (−8.2%), Hammersmith and Fulham (−7.7%) and Barnet (−5.1%) are all expected to fall, joined by City of Aberdeen in Scotland (−5.9%) and Thanet in Kent (−3.3%). The short-term story, then, is little changed: the correction is still biting hardest in the capital and in Aberdeen’s oil-exposed market.
24-month prediction (to April 2028)
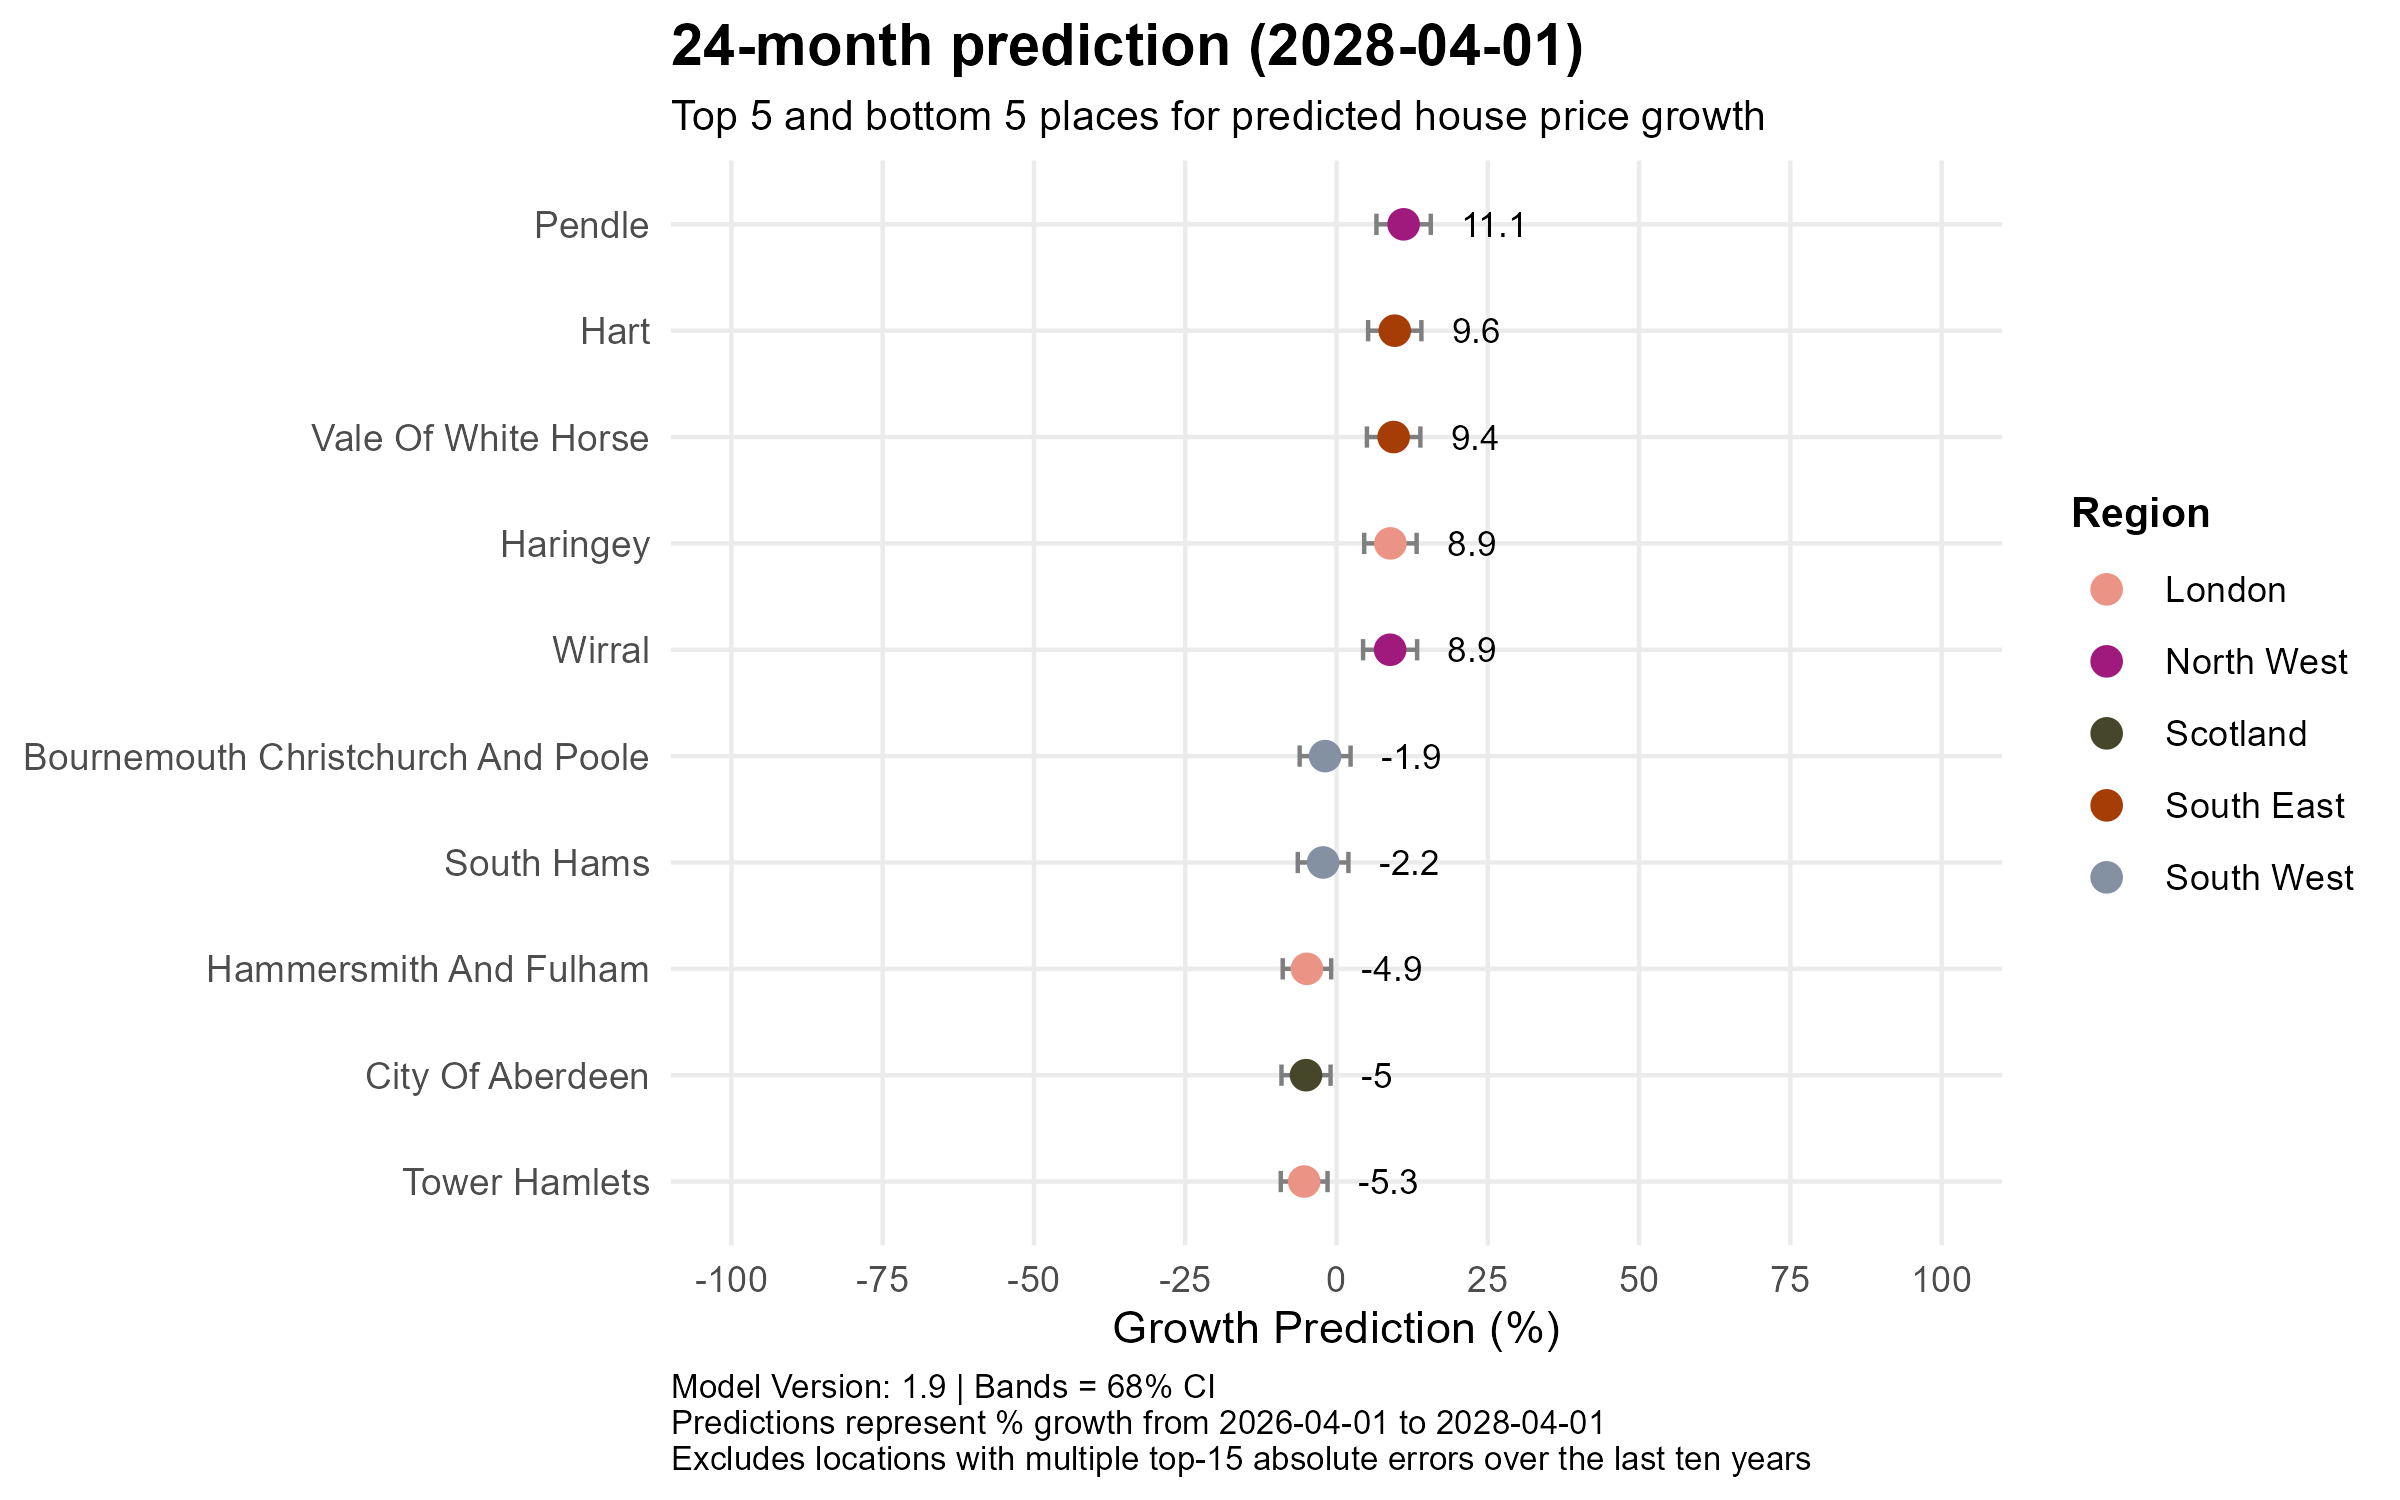
By the two-year horizon the composition begins to shift. Pendle (+11.1%) still leads, but two South East commuter areas — Hart (+9.6%) and Vale of White Horse (+9.4%) — climb into the top five alongside Wirral (+8.9%), and, tellingly, a London borough appears among the winners for the first time in months as Haringey reaches +8.9%. The laggards are softening too: Tower Hamlets (−5.3%), City of Aberdeen (−5.0%) and Hammersmith and Fulham (−4.9%) remain negative but their losses are shrinking, with two South West coastal markets — South Hams (−2.2%) and Bournemouth Christchurch and Poole (−1.9%) — completing the bottom five.
60-month prediction (to April 2031)
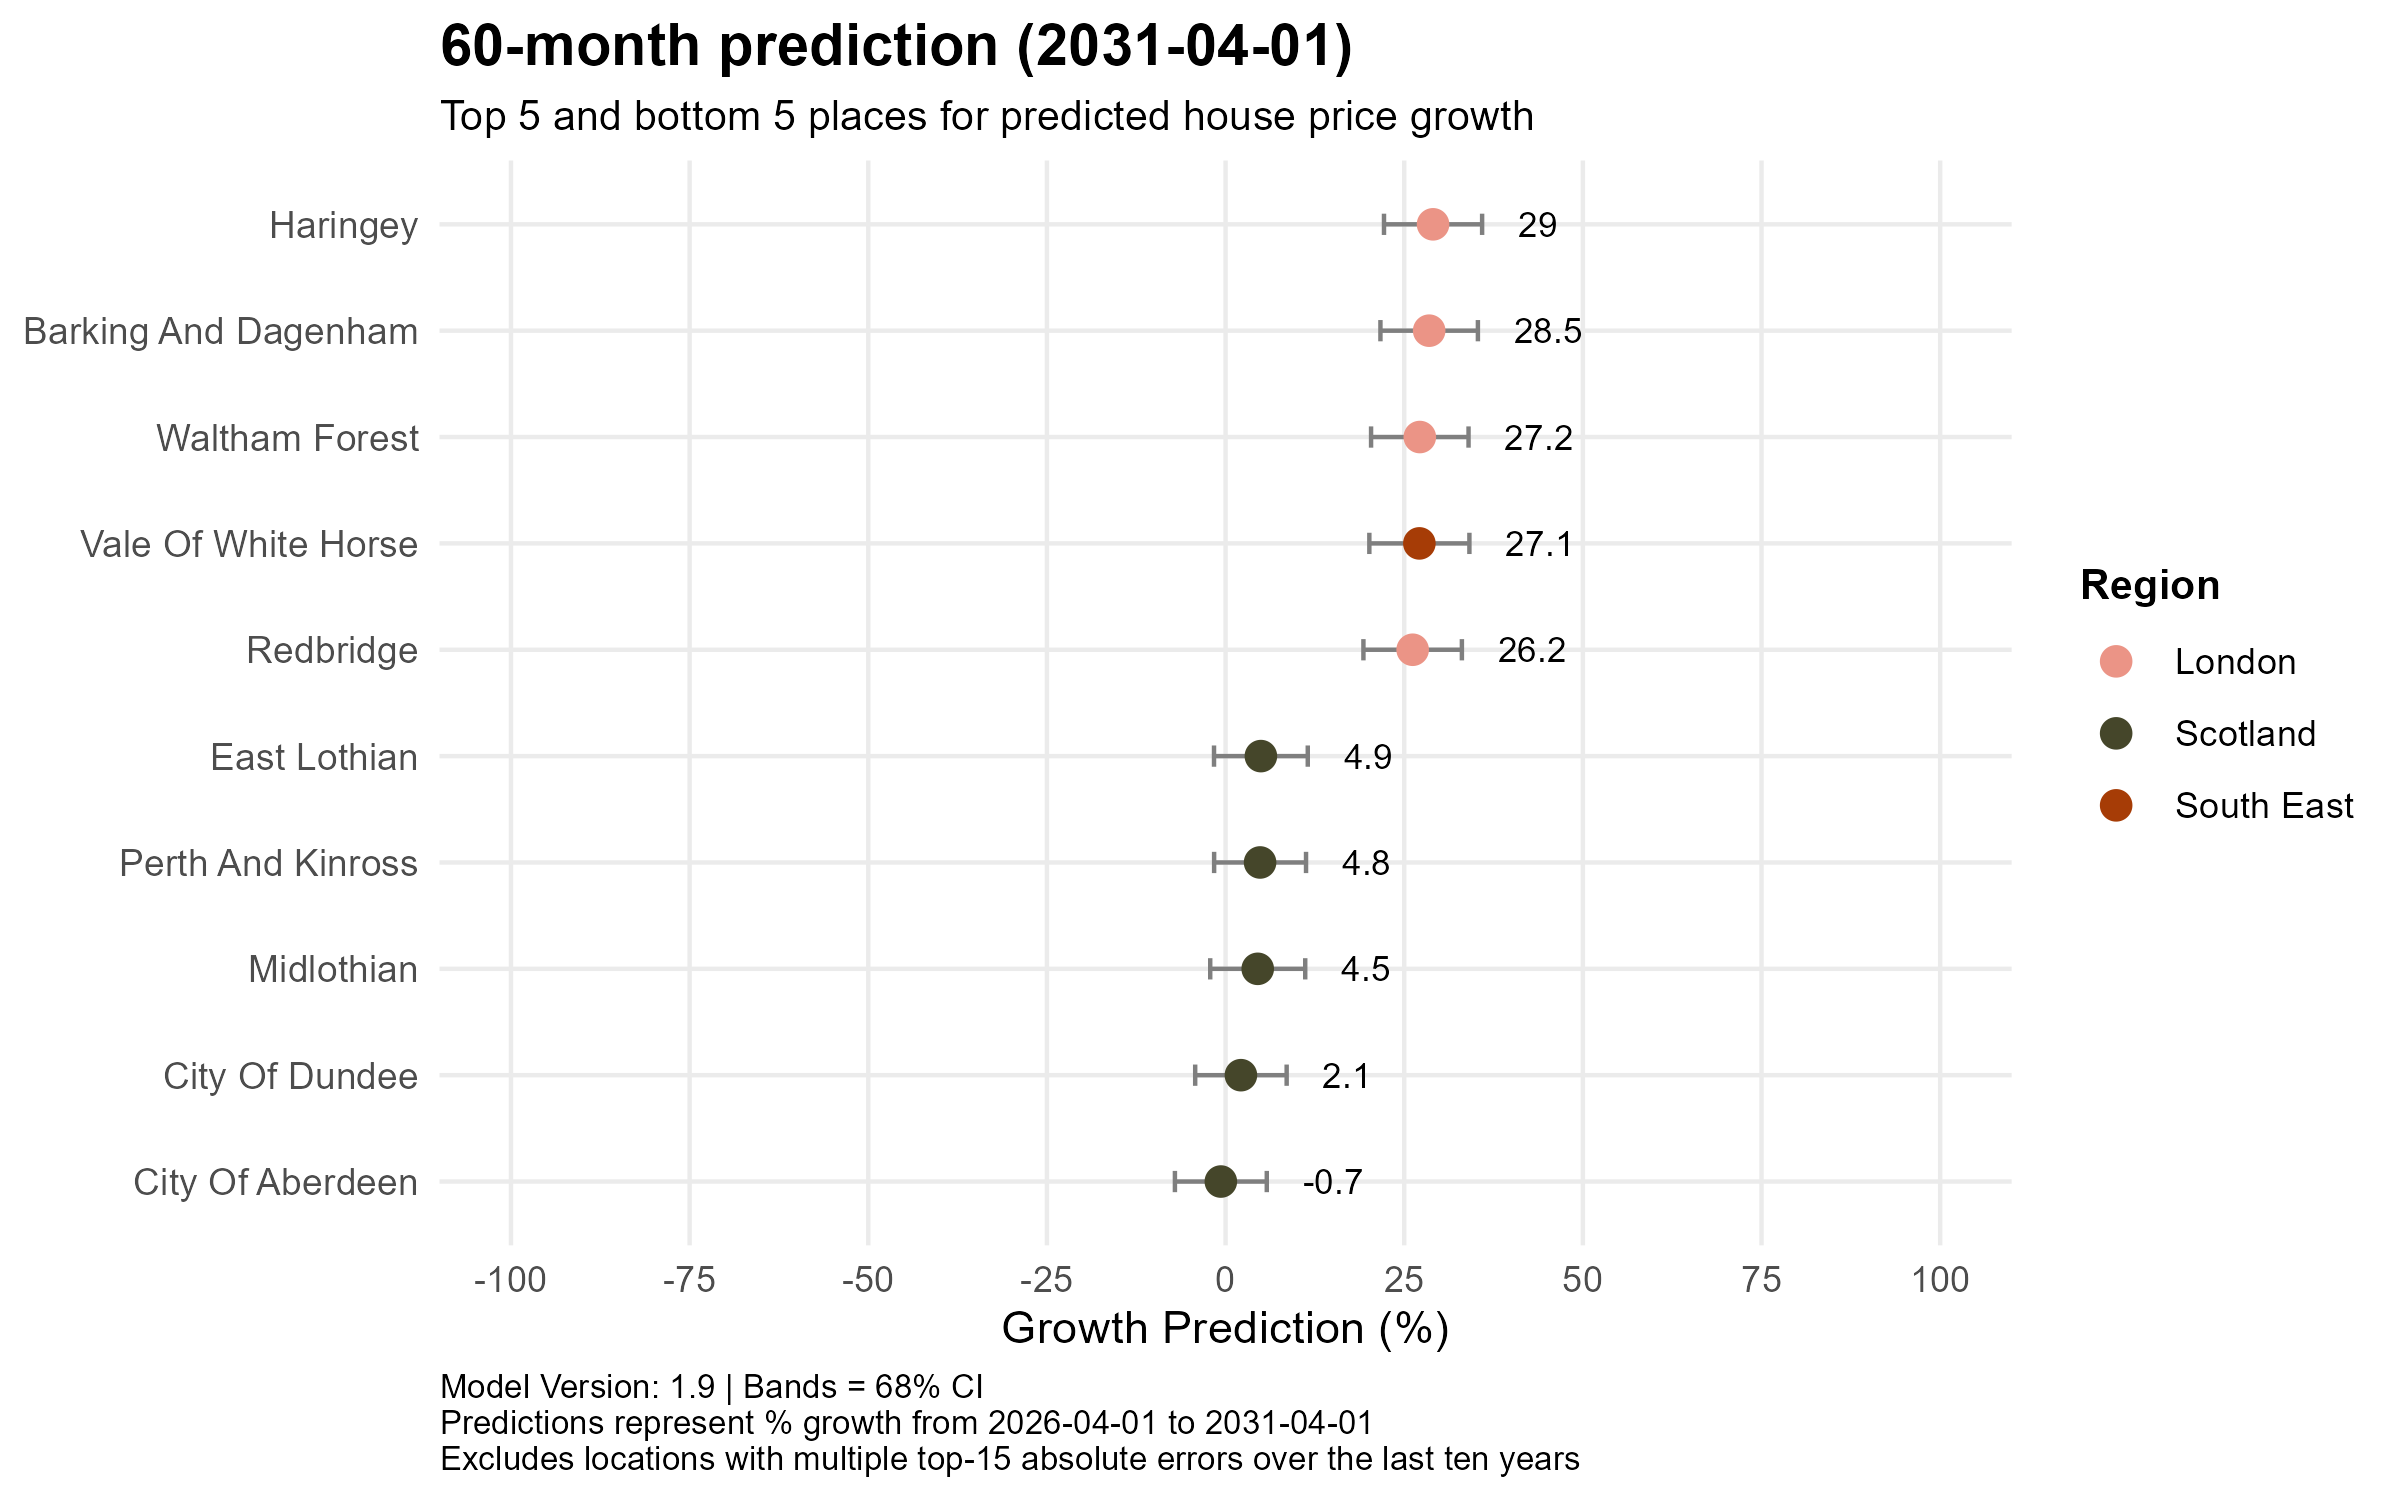
The five-year view completes the rebalancing and turns the recent narrative on its head. London boroughs now sweep the top of the leaderboard — Haringey (+29%), Barking and Dagenham (+28.5%), Waltham Forest (+27.2%) and Redbridge (+26.2%) — joined only by Vale of White Horse in Oxfordshire (+27.1%), as the capital’s earlier correction gives way to the strongest long-run gains in the country. At the other end, the bottom five are drawn entirely from Scotland, led by City of Aberdeen — the sole area still fractionally negative at −0.7% — alongside City of Dundee (+2.1%), Midlothian (+4.5%), Perth and Kinross (+4.8%) and East Lothian (+4.9%). The affordability that powered Northern Ireland and the North in the short term ultimately gives way to a London-led recovery, while Scotland’s structural weakness persists across the whole horizon.
Conclusion
The rebalancing theme that has run through recent editions is maturing into something more surprising. In the near term the affordable North, Northern Ireland and Wales still lead, and the correction continues to weigh on London and Aberdeen. But the ONS’s substantial upward revision, together with London’s much-improved affordability, has flipped the medium- and long-run picture: the capital and the wider South East now top the five-year rankings, while Scotland — especially its oil-exposed north-east — emerges as the persistent laggard. As last month’s post also noted, the direction of travel remains steady rather than dramatic. Nationally, the model still points to a gradual climb towards £304k by 2031 — no boom, but no crash either.

Leave a comment