Economic summary
News
The UK economic backdrop remained under significant pressure in May. UK inflation eased to 2.8% in April, down from 3.3% in March, helped by lower household energy bills, though the Bank of England warned that continued disruption in the Strait of Hormuz could push inflation back towards 4% by year-end as oil and shipping costs rise. The S&P Global Flash UK PMI composite index fell to 48.5 in May, below the 50-point growth threshold for the first time in over a year, with services activity dropping to a 64-month low of 47.9. According to the ONS Business Insights and Conditions Survey, 34% of trading businesses reported economic uncertainty impacting turnover in early May, five percentage points higher than a year ago.
Indicators
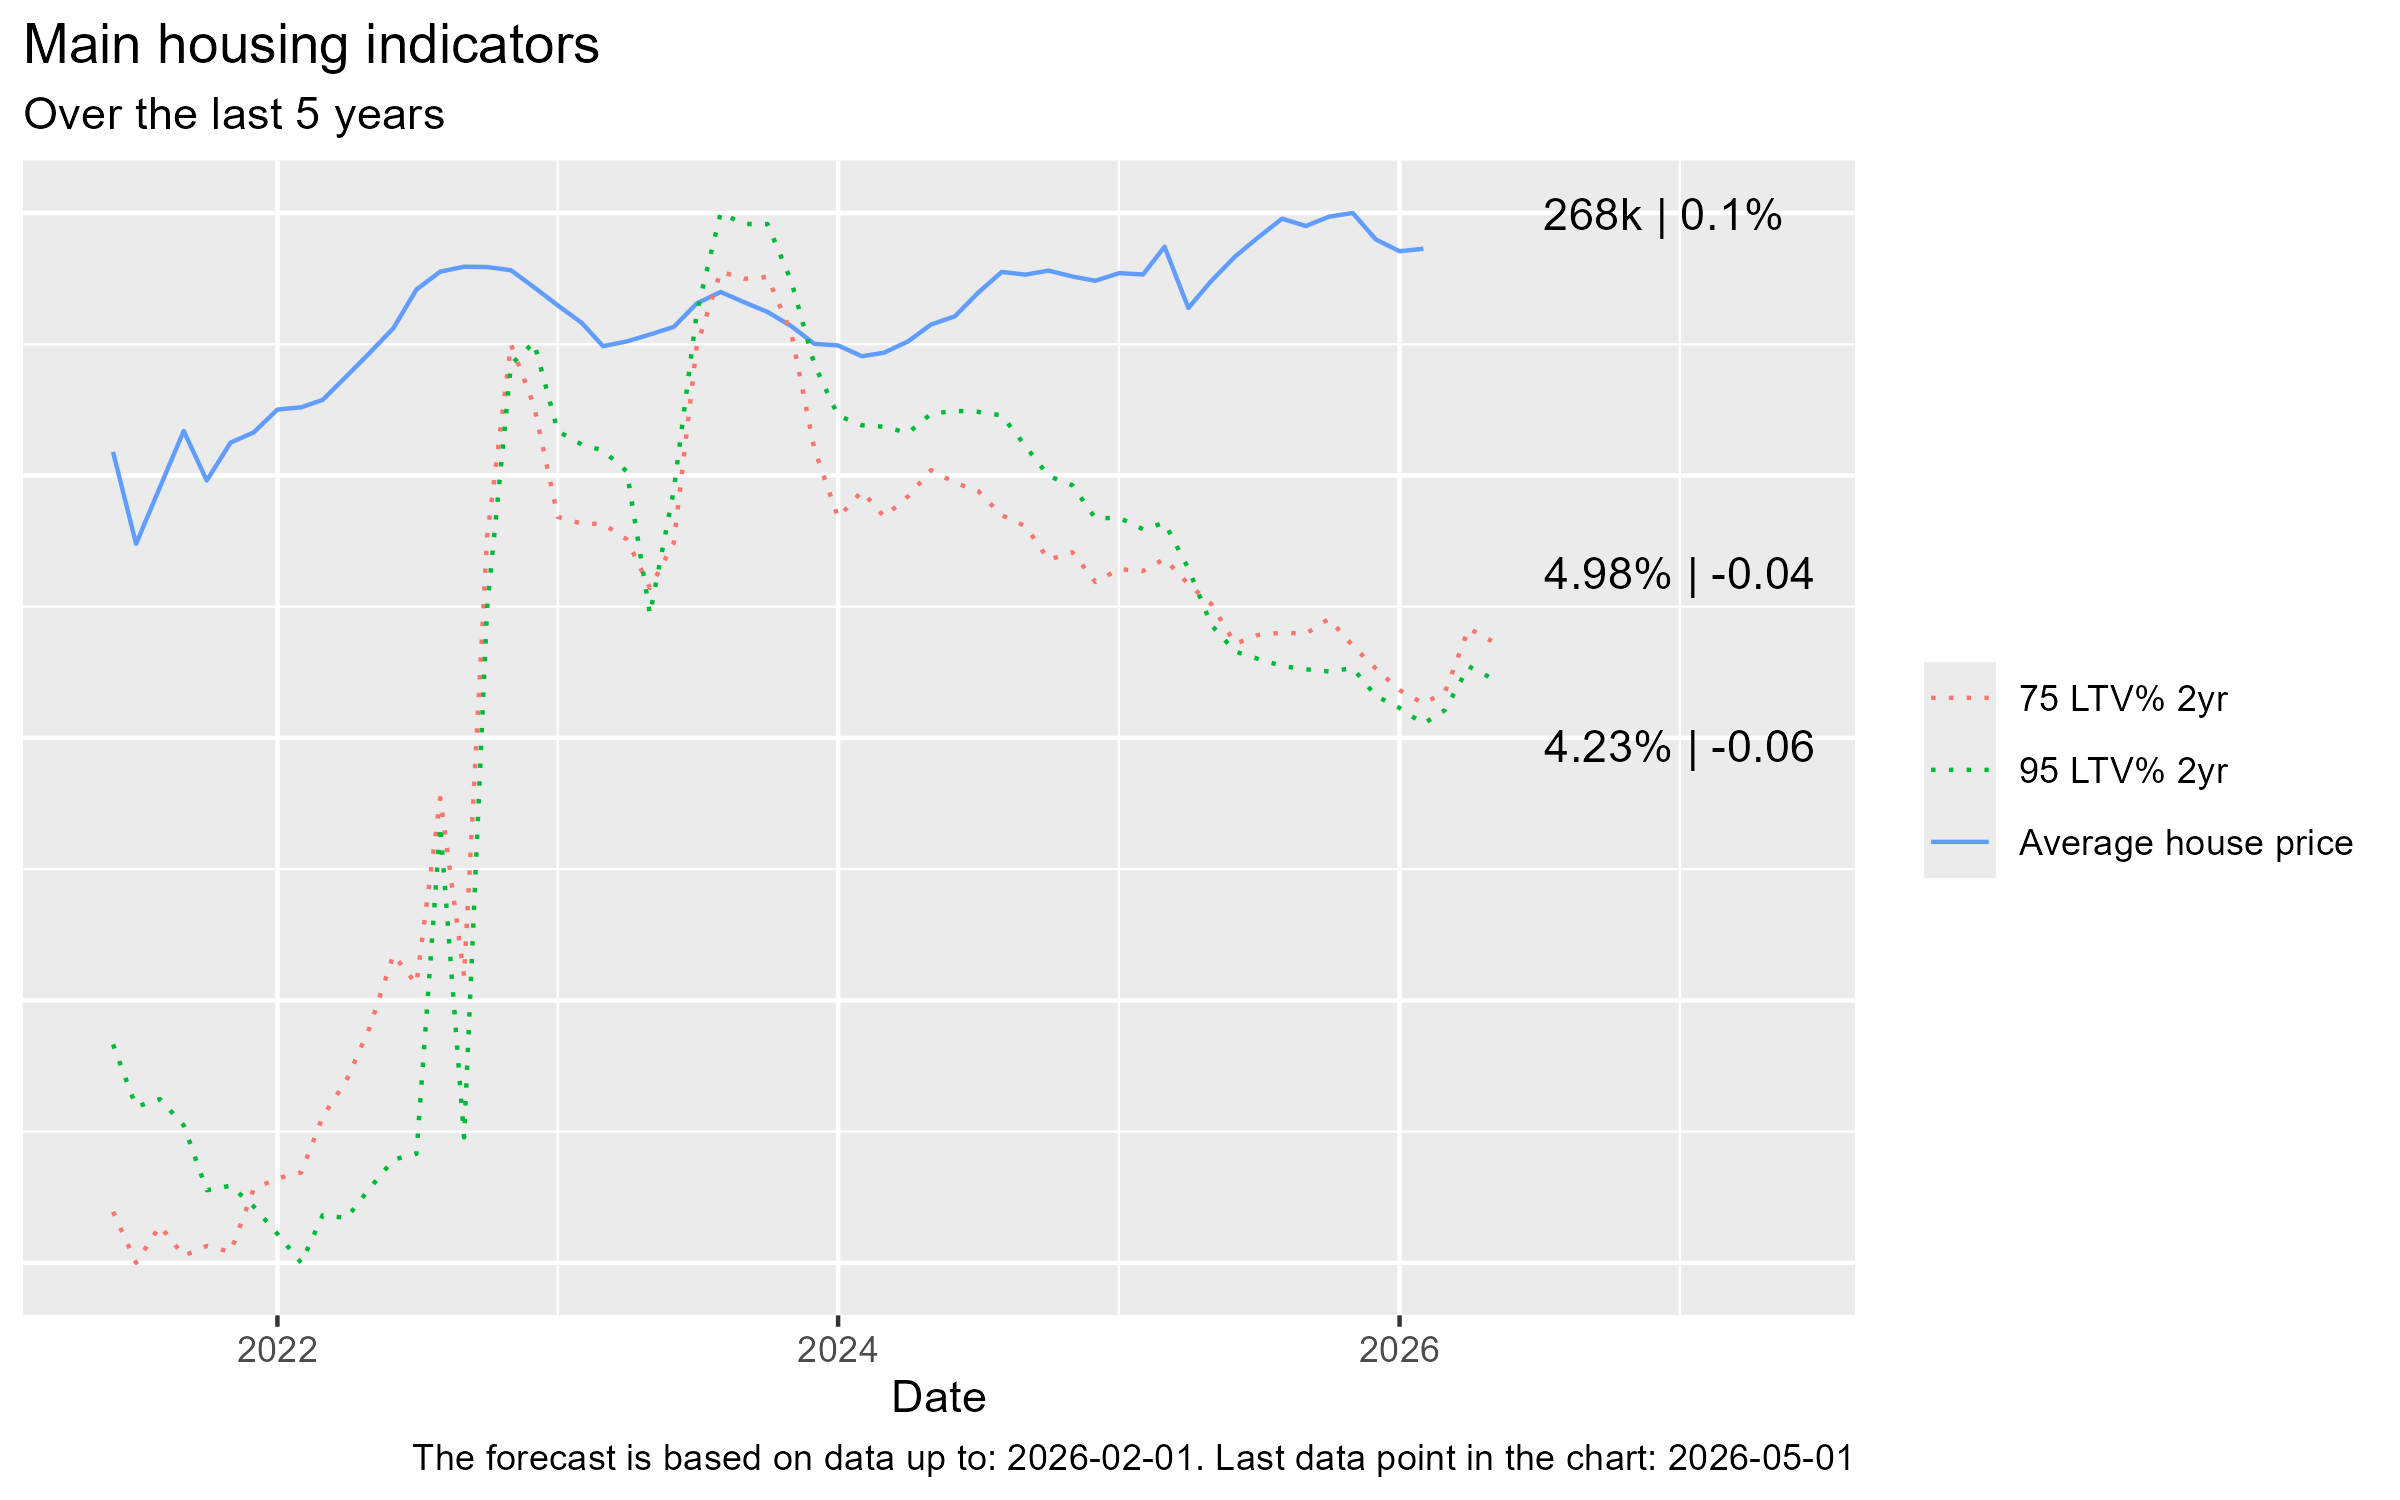
- Average house prices decreased very slightly to £268k on the previous month (-0.4%)
- The average 75% LTV 2-year mortgage rate eased slightly to 4.23%, whilst the average 95% LTV 2-year rate fell to 4.98%.
Home affordability
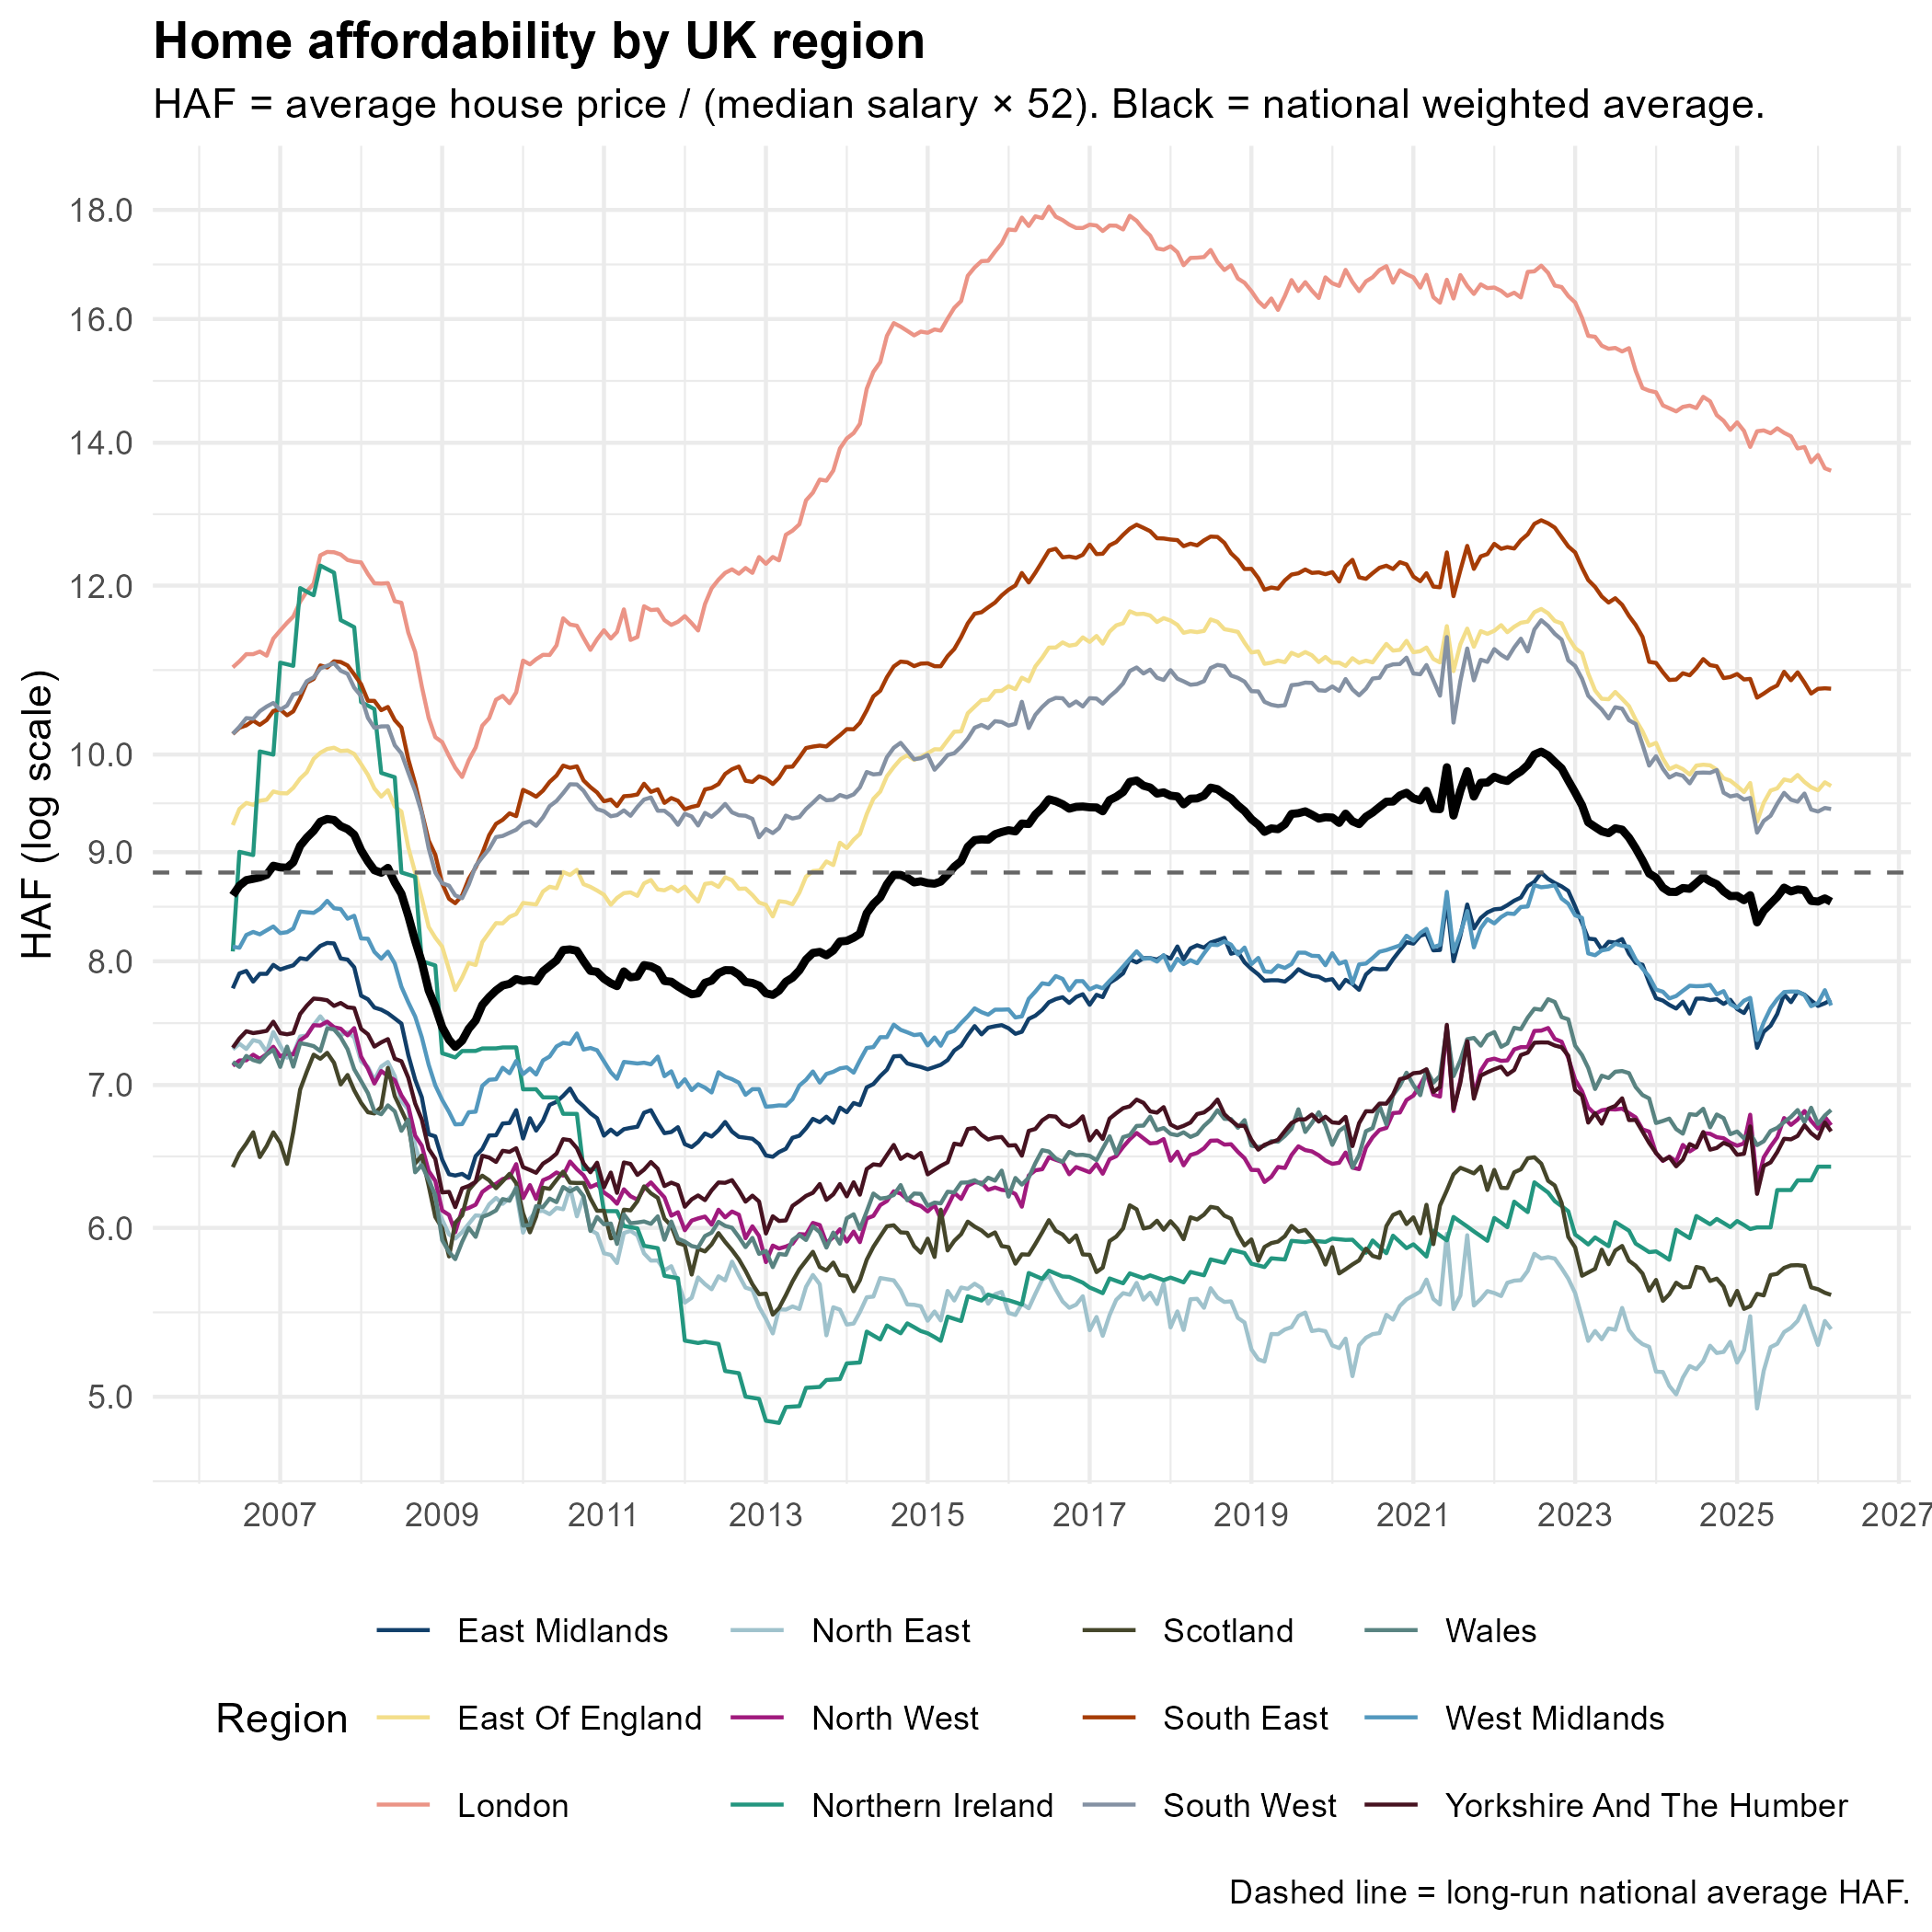
This month we are featuring the Home Affordability Factor (HAF), defined as average house price divided by median annual salary (median weekly salary × 52), tracked by region over nearly two decades. The national weighted average (black line) currently sits at approximately 8.8, back in line with the long-run historical mean (dashed line) after peaking at around 10.0 in 2022–23. London remains strikingly unaffordable at roughly 13.8 times annual salary, though this has fallen sharply from its peak of 18 in 2016, reflecting both price softening and wage growth. At the other end, Northern Ireland and Yorkshire and The Humber are among the most affordable regions at around 6.5, underpinning the demand momentum evident in their price growth figures.
Current growth rates
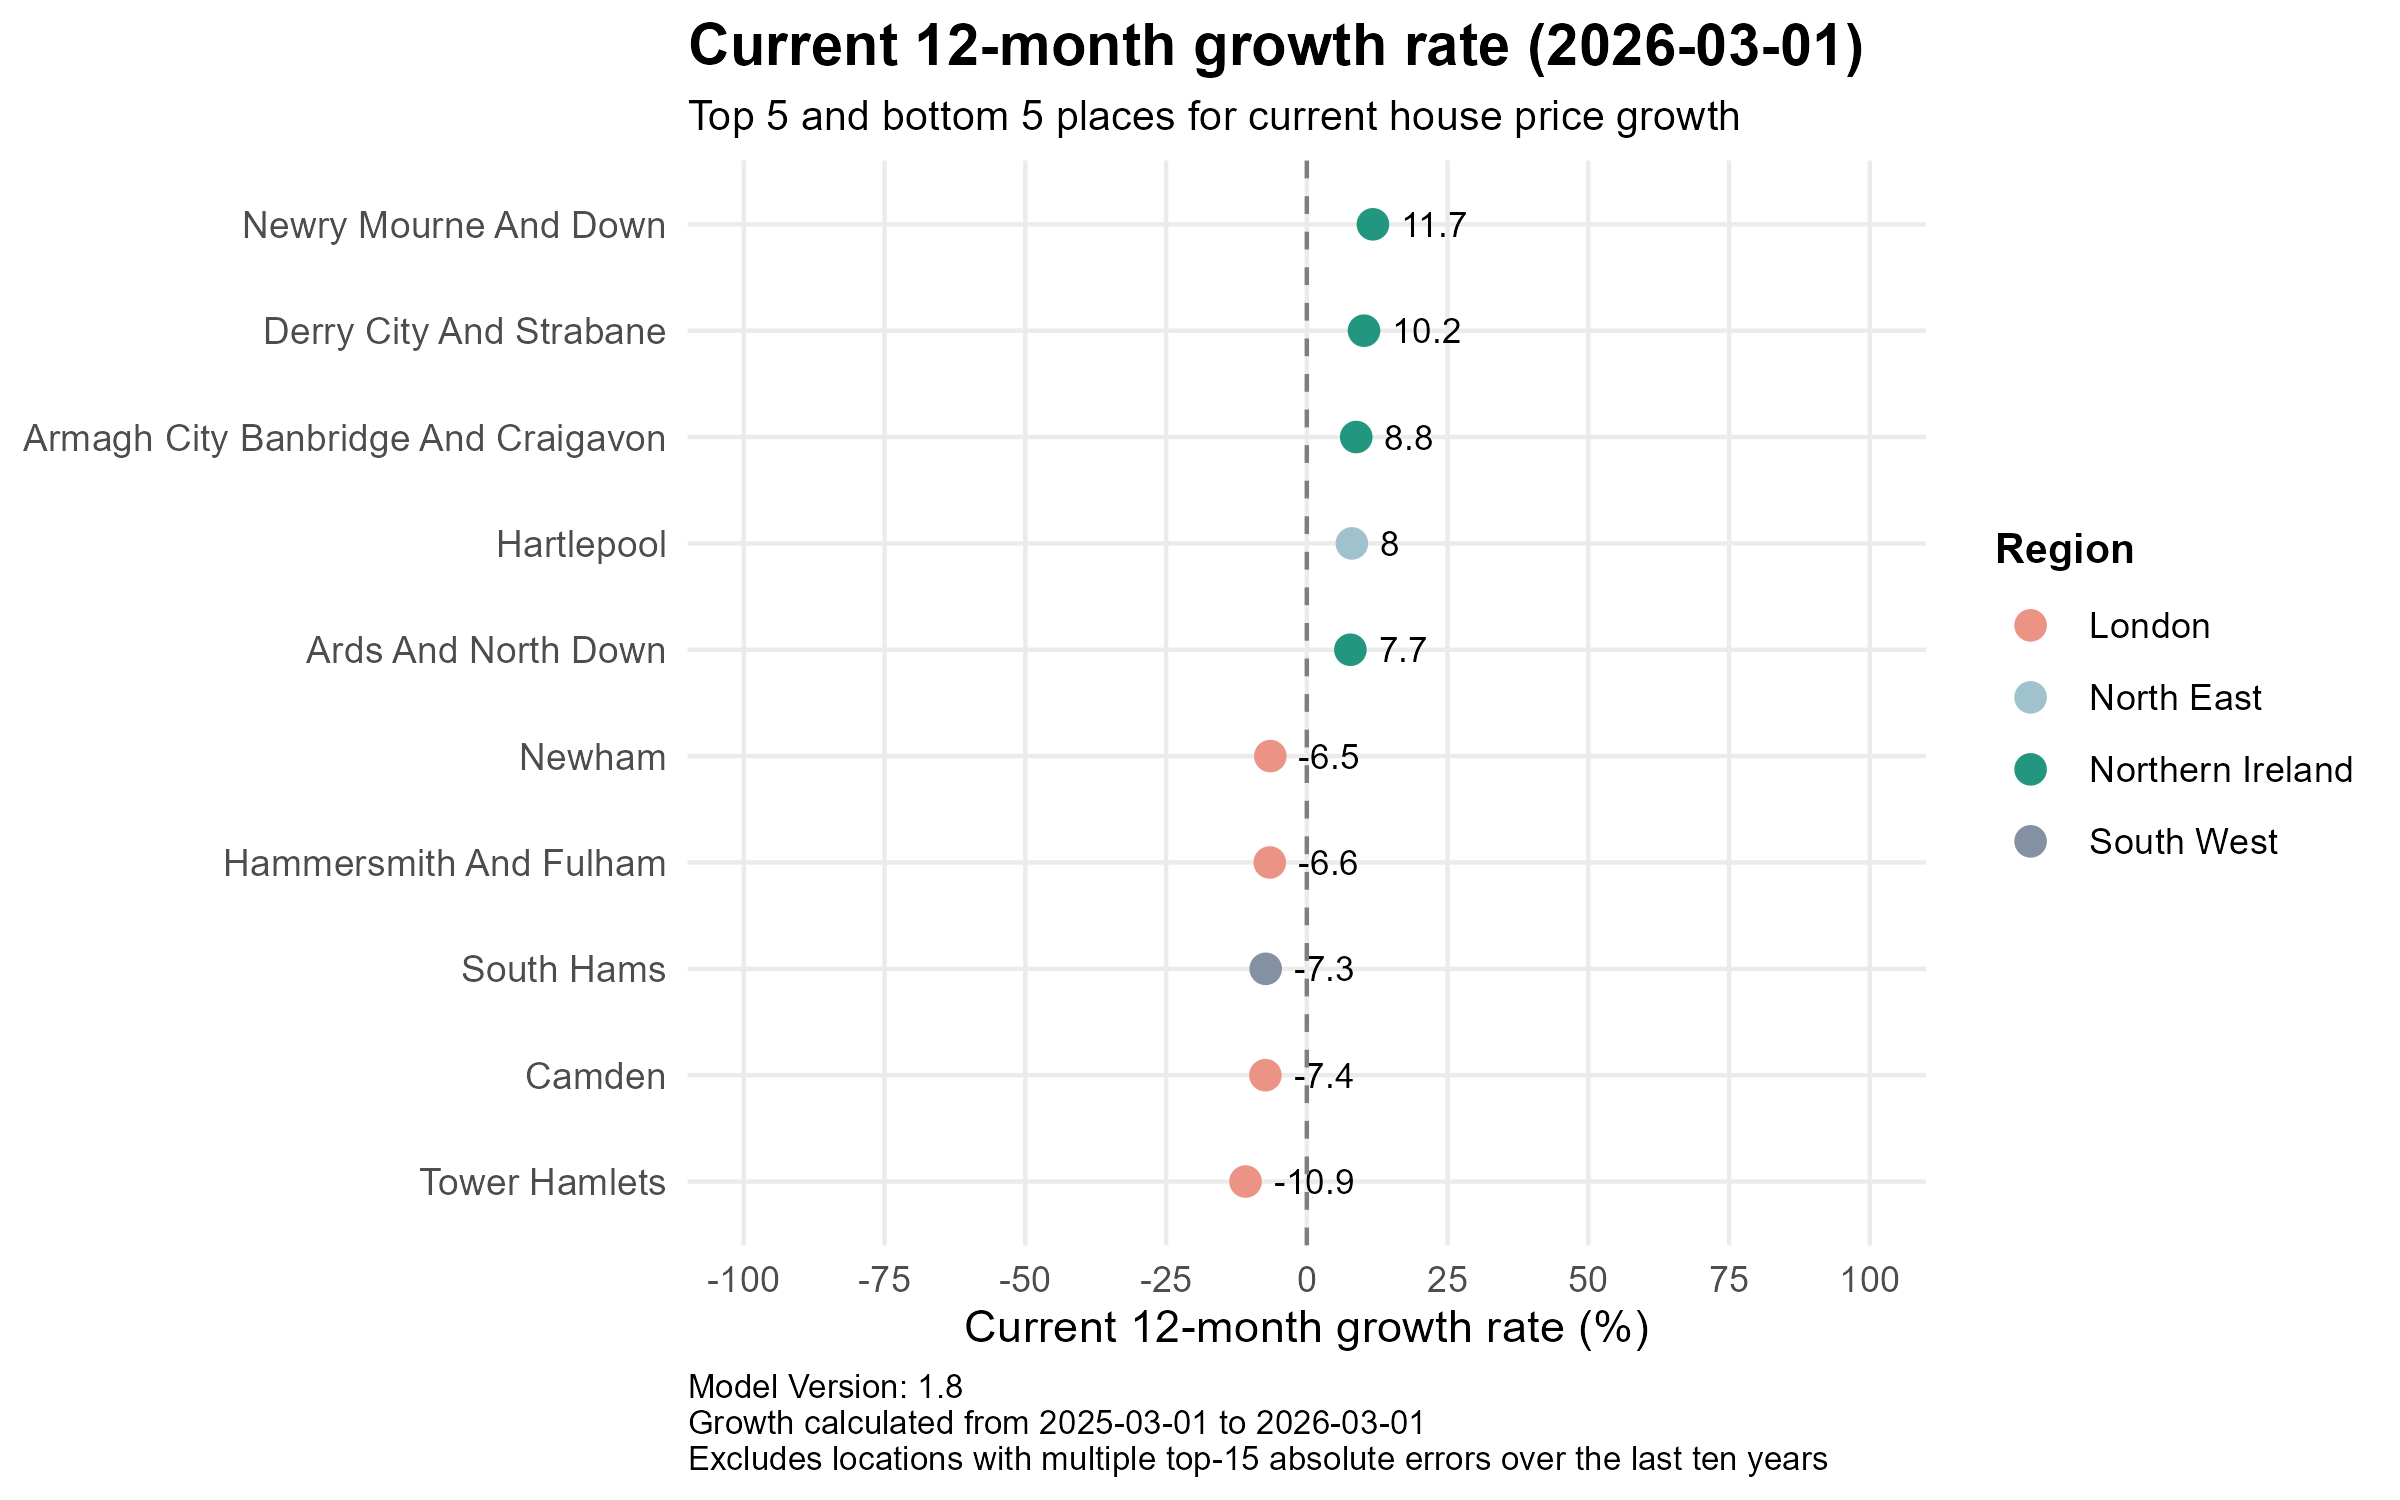
The north–south divergence in house price performance remains striking. Northern Ireland continues to lead all UK regions by a considerable margin, with four of the top five fastest-growing local areas drawn from the province. Newry Mourne and Down tops the table with a 12-month growth rate of +11.7%, followed by Derry City and Strabane (+10.2%), Armagh City Banbridge and Craigavon (+8.8%) and Ards and North Down (+7.7%), with Hartlepool (+8.0%) in the North East the sole English entry. The contrast with London is stark: Tower Hamlets (-10.9%), Camden (-7.4%), South Hams in the South West (-7.3%), Hammersmith and Fulham (-6.6%) and Newham (-6.5%) occupy the five weakest positions, underscoring that affordability stress and elevated mortgage rates continue to bite hardest in high-value urban and coastal markets.
Predictions
Overall
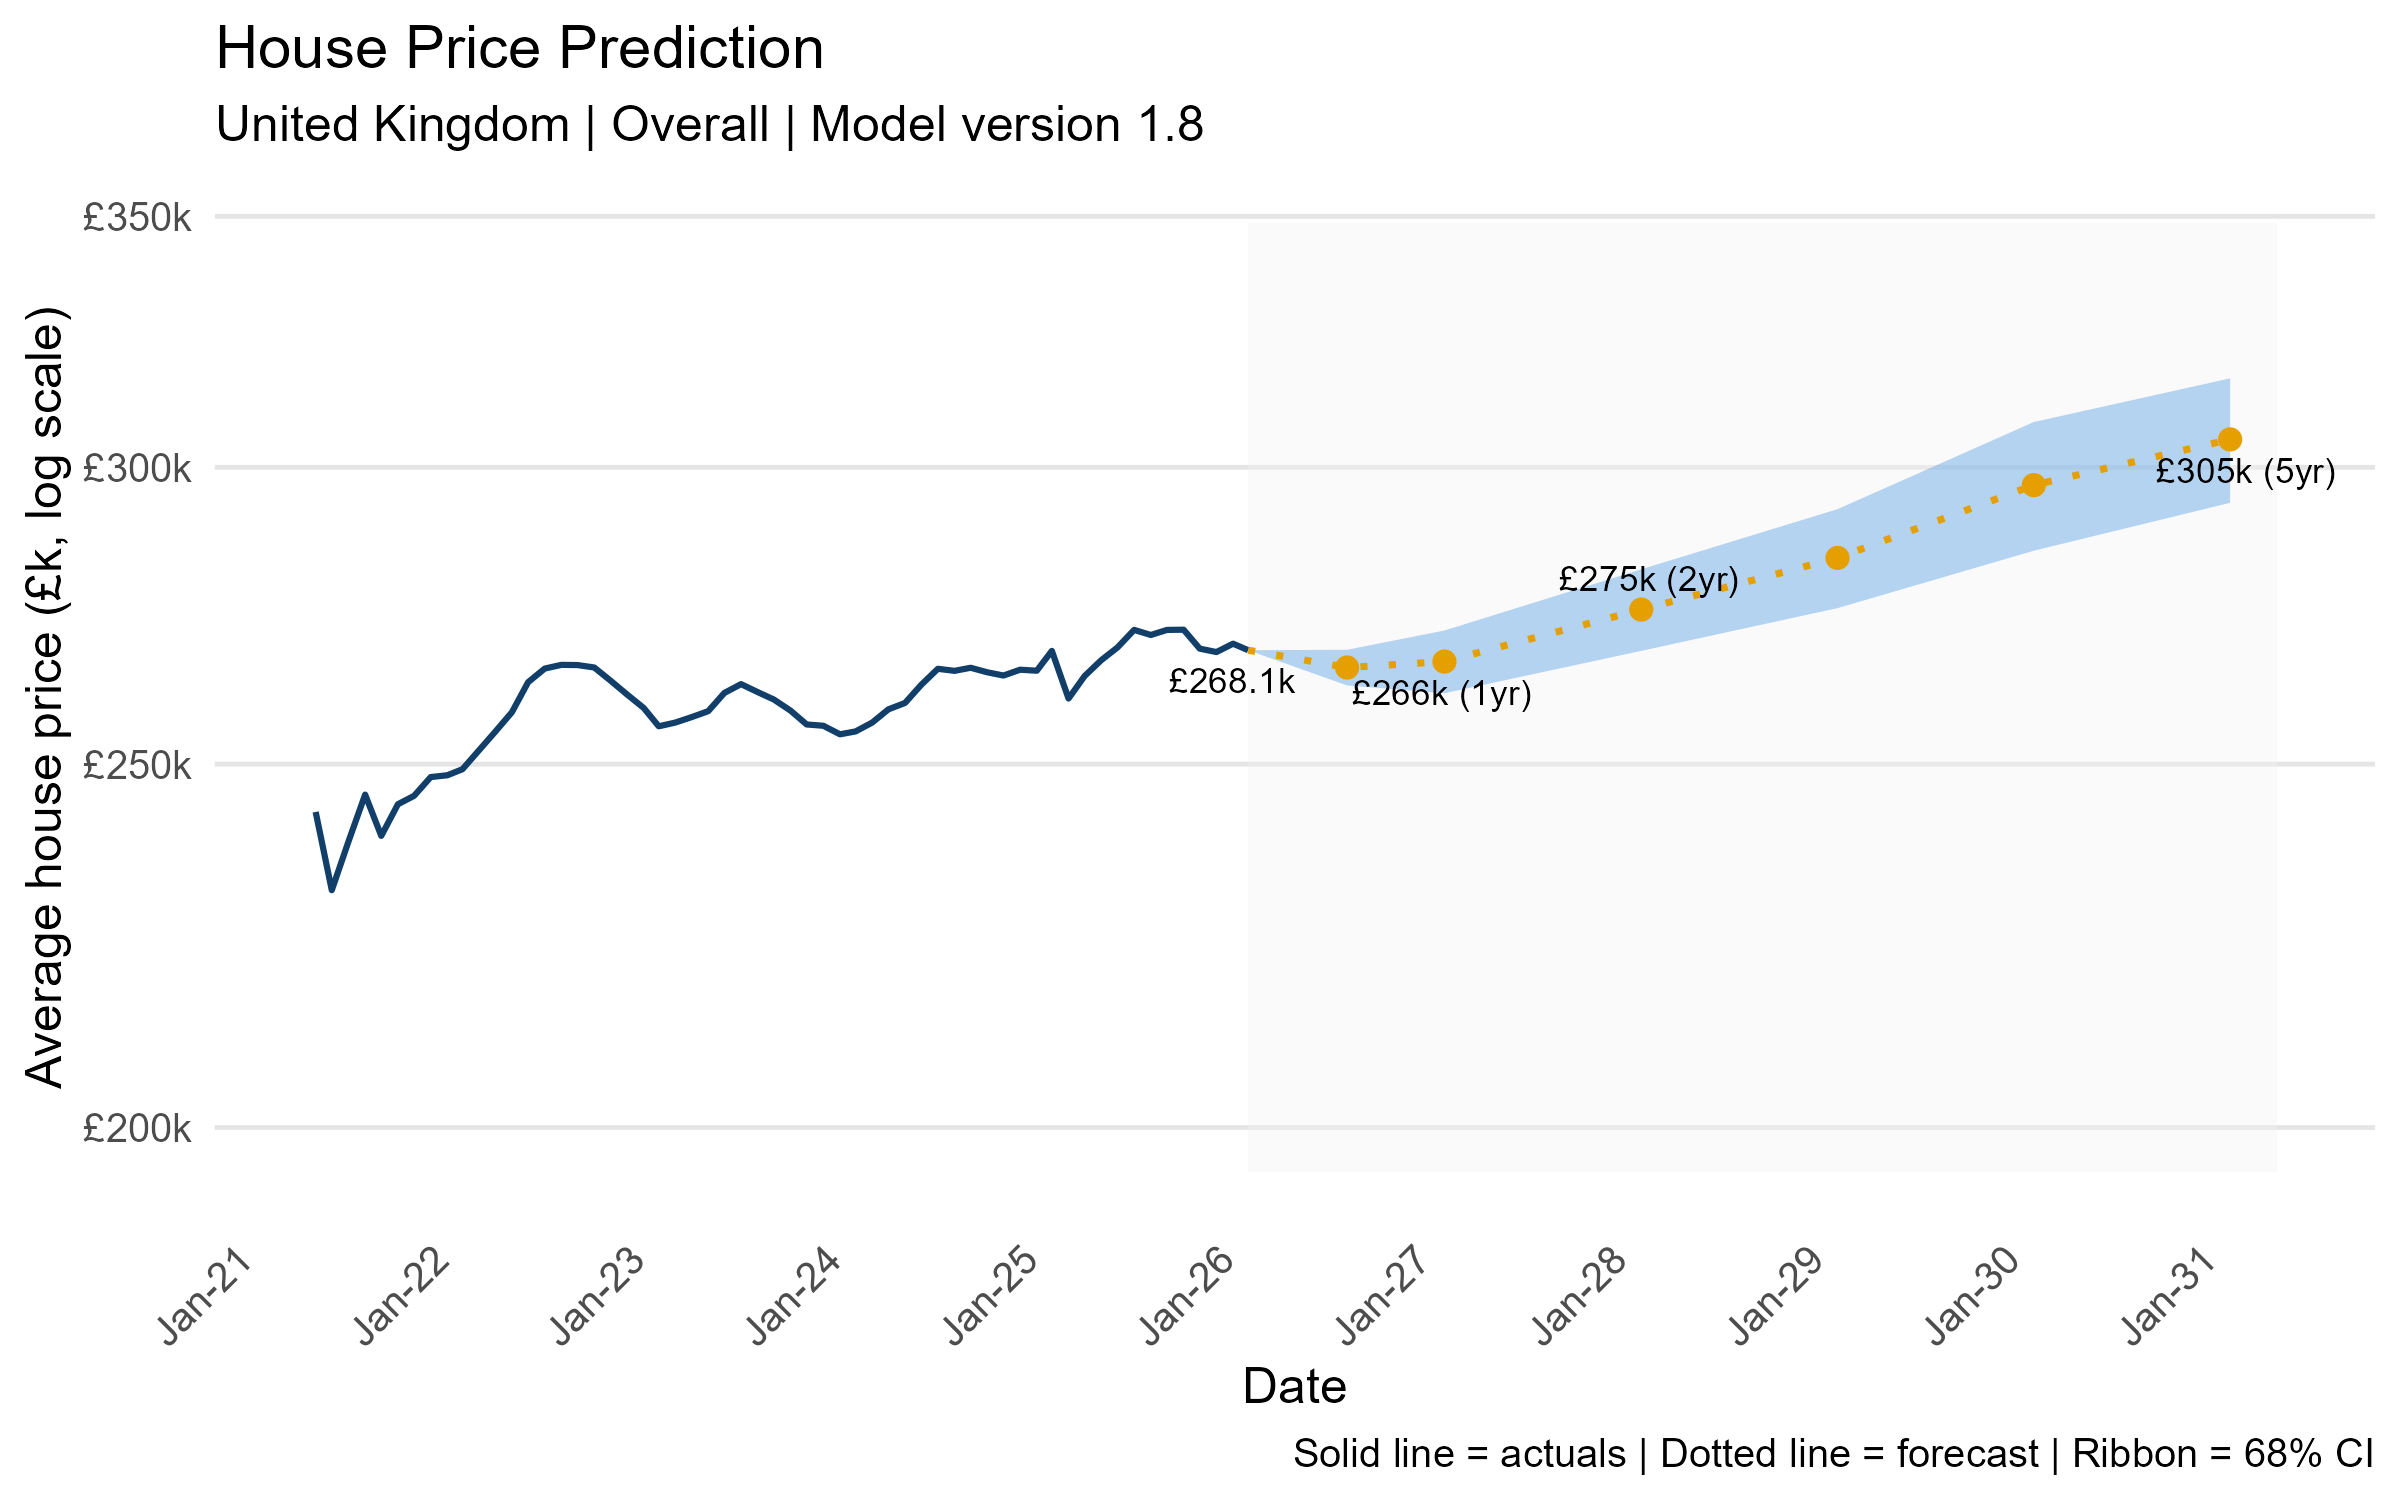
The model projects a modest near-term dip before recovery resumes. From the current average of £268.1k, prices are forecast to ease marginally to £266k within one year before rebounding to £275k by 2028 and reaching £305k by March 2031 — representing cumulative growth of approximately 14% over five years. The widening confidence interval beyond the two-year horizon reflects the genuine uncertainty posed by the geopolitical and macroeconomic environment.
Regional
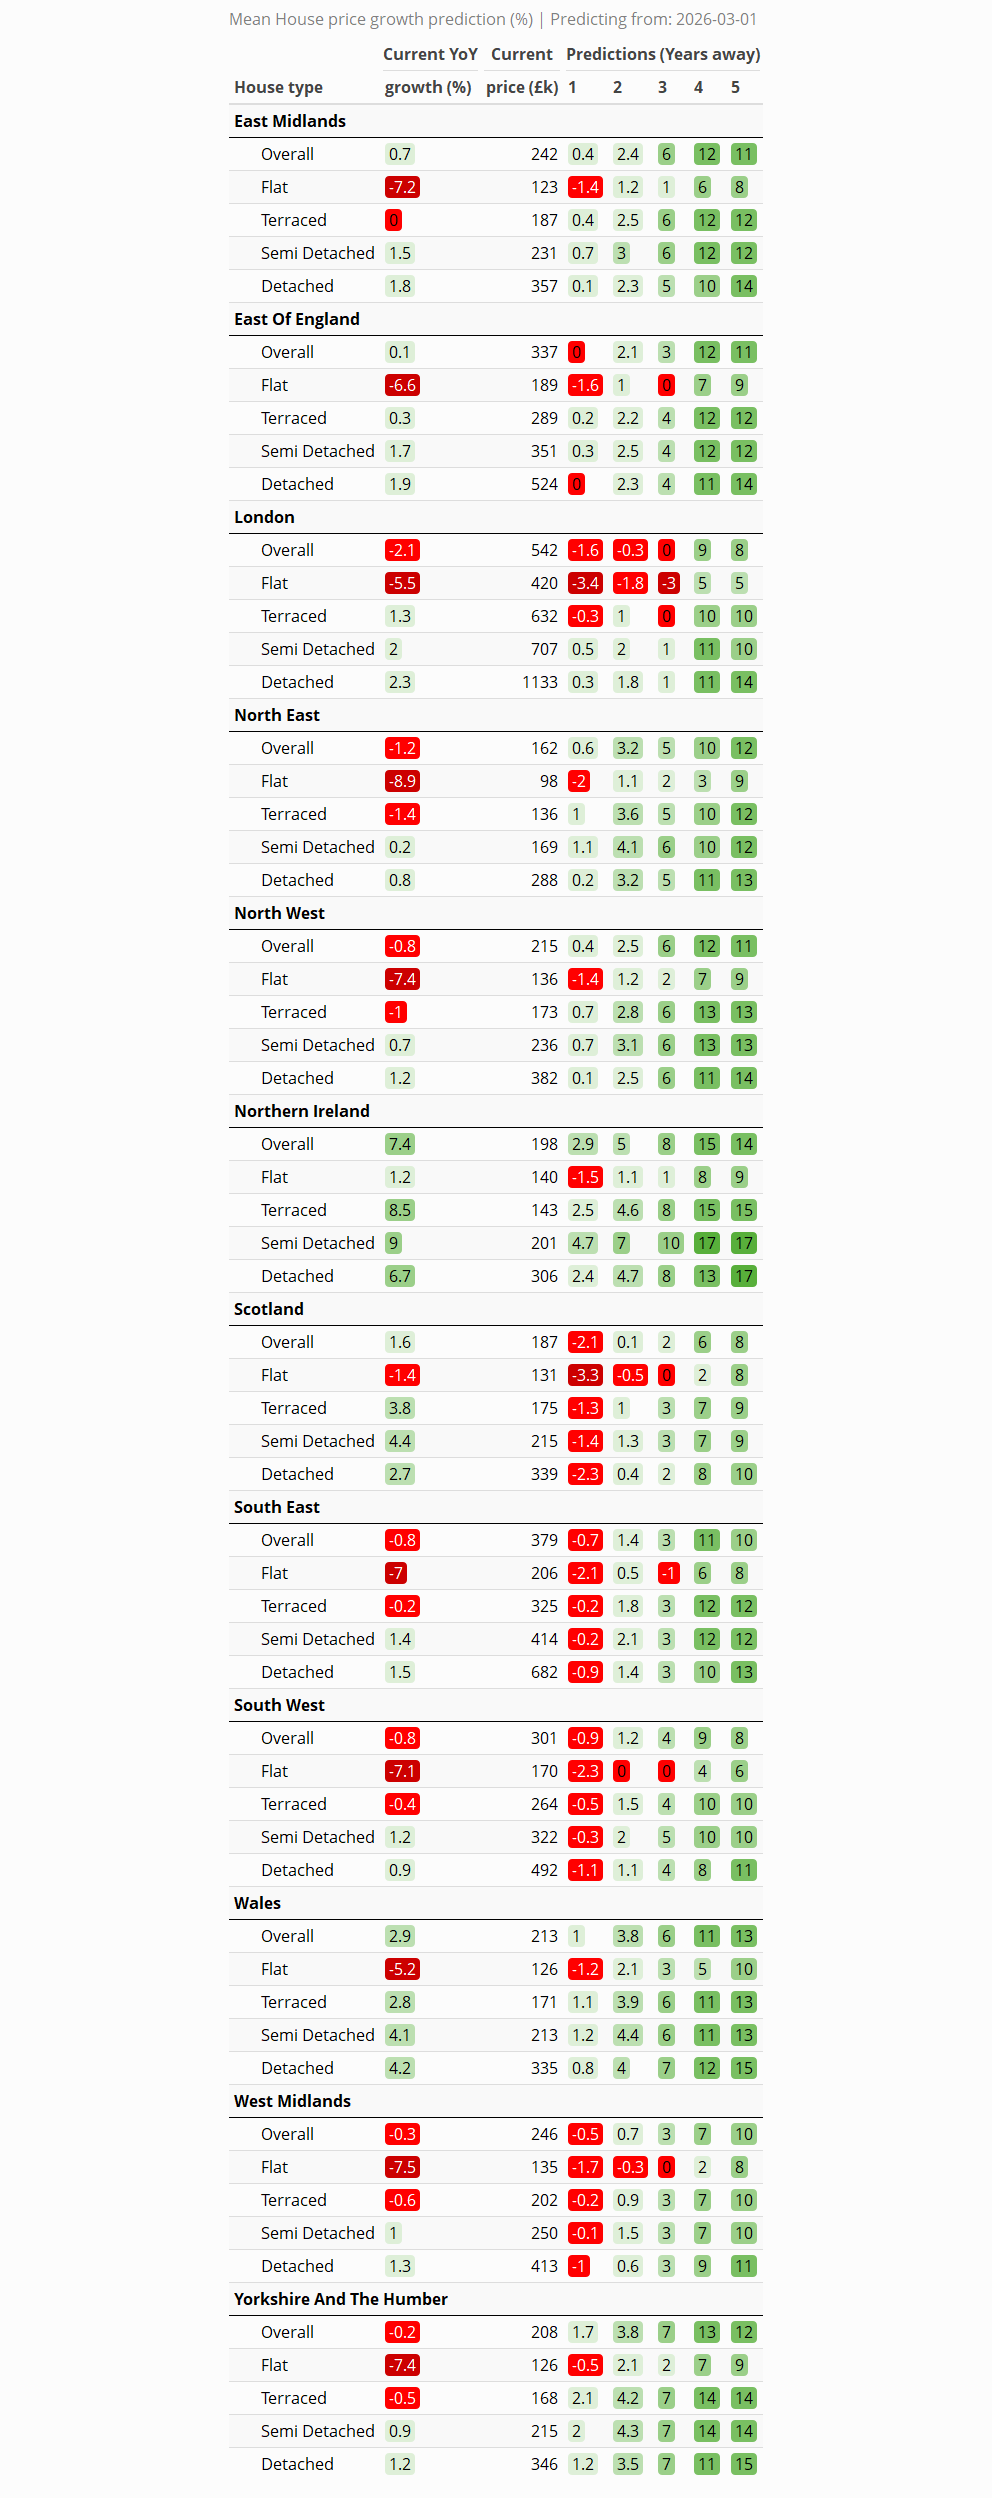
Short term (years 1–2): Northern Ireland is the clear standout in the near term, with overall prices forecast to grow 2.9% in year one and 5% by year two, the strongest short-term trajectory of any region. By contrast, London and Scotland are the only regions forecast to record negative growth in year one (-1.6% and -2.1% respectively), with London only fractionally recovering to -0.3% by year two.
Medium term (years 3–4): The picture brightens meaningfully across most regions by years three and four, with Northern Ireland accelerating strongly to 8% and 15% cumulative growth respectively — the fastest of any region. Yorkshire and The Humber, Wales and the North West all reach 6–7% by year three and 11–13% by year four, while London finally turns positive in year three, reaching around 9% by year four as the correction fades.
Long term (year 5): Northern Ireland leads the five-year rankings at +14%, closely followed by Wales (+13%) and Yorkshire and The Humber (+12%). The North West, East Midlands and North East all achieve double-digit gains of 11–12%. London and Scotland lag the national picture with 5-year cumulative growth of 8%, solid but well below the affordable northern and Irish markets that have driven the rebalancing story throughout this forecast period.
Local
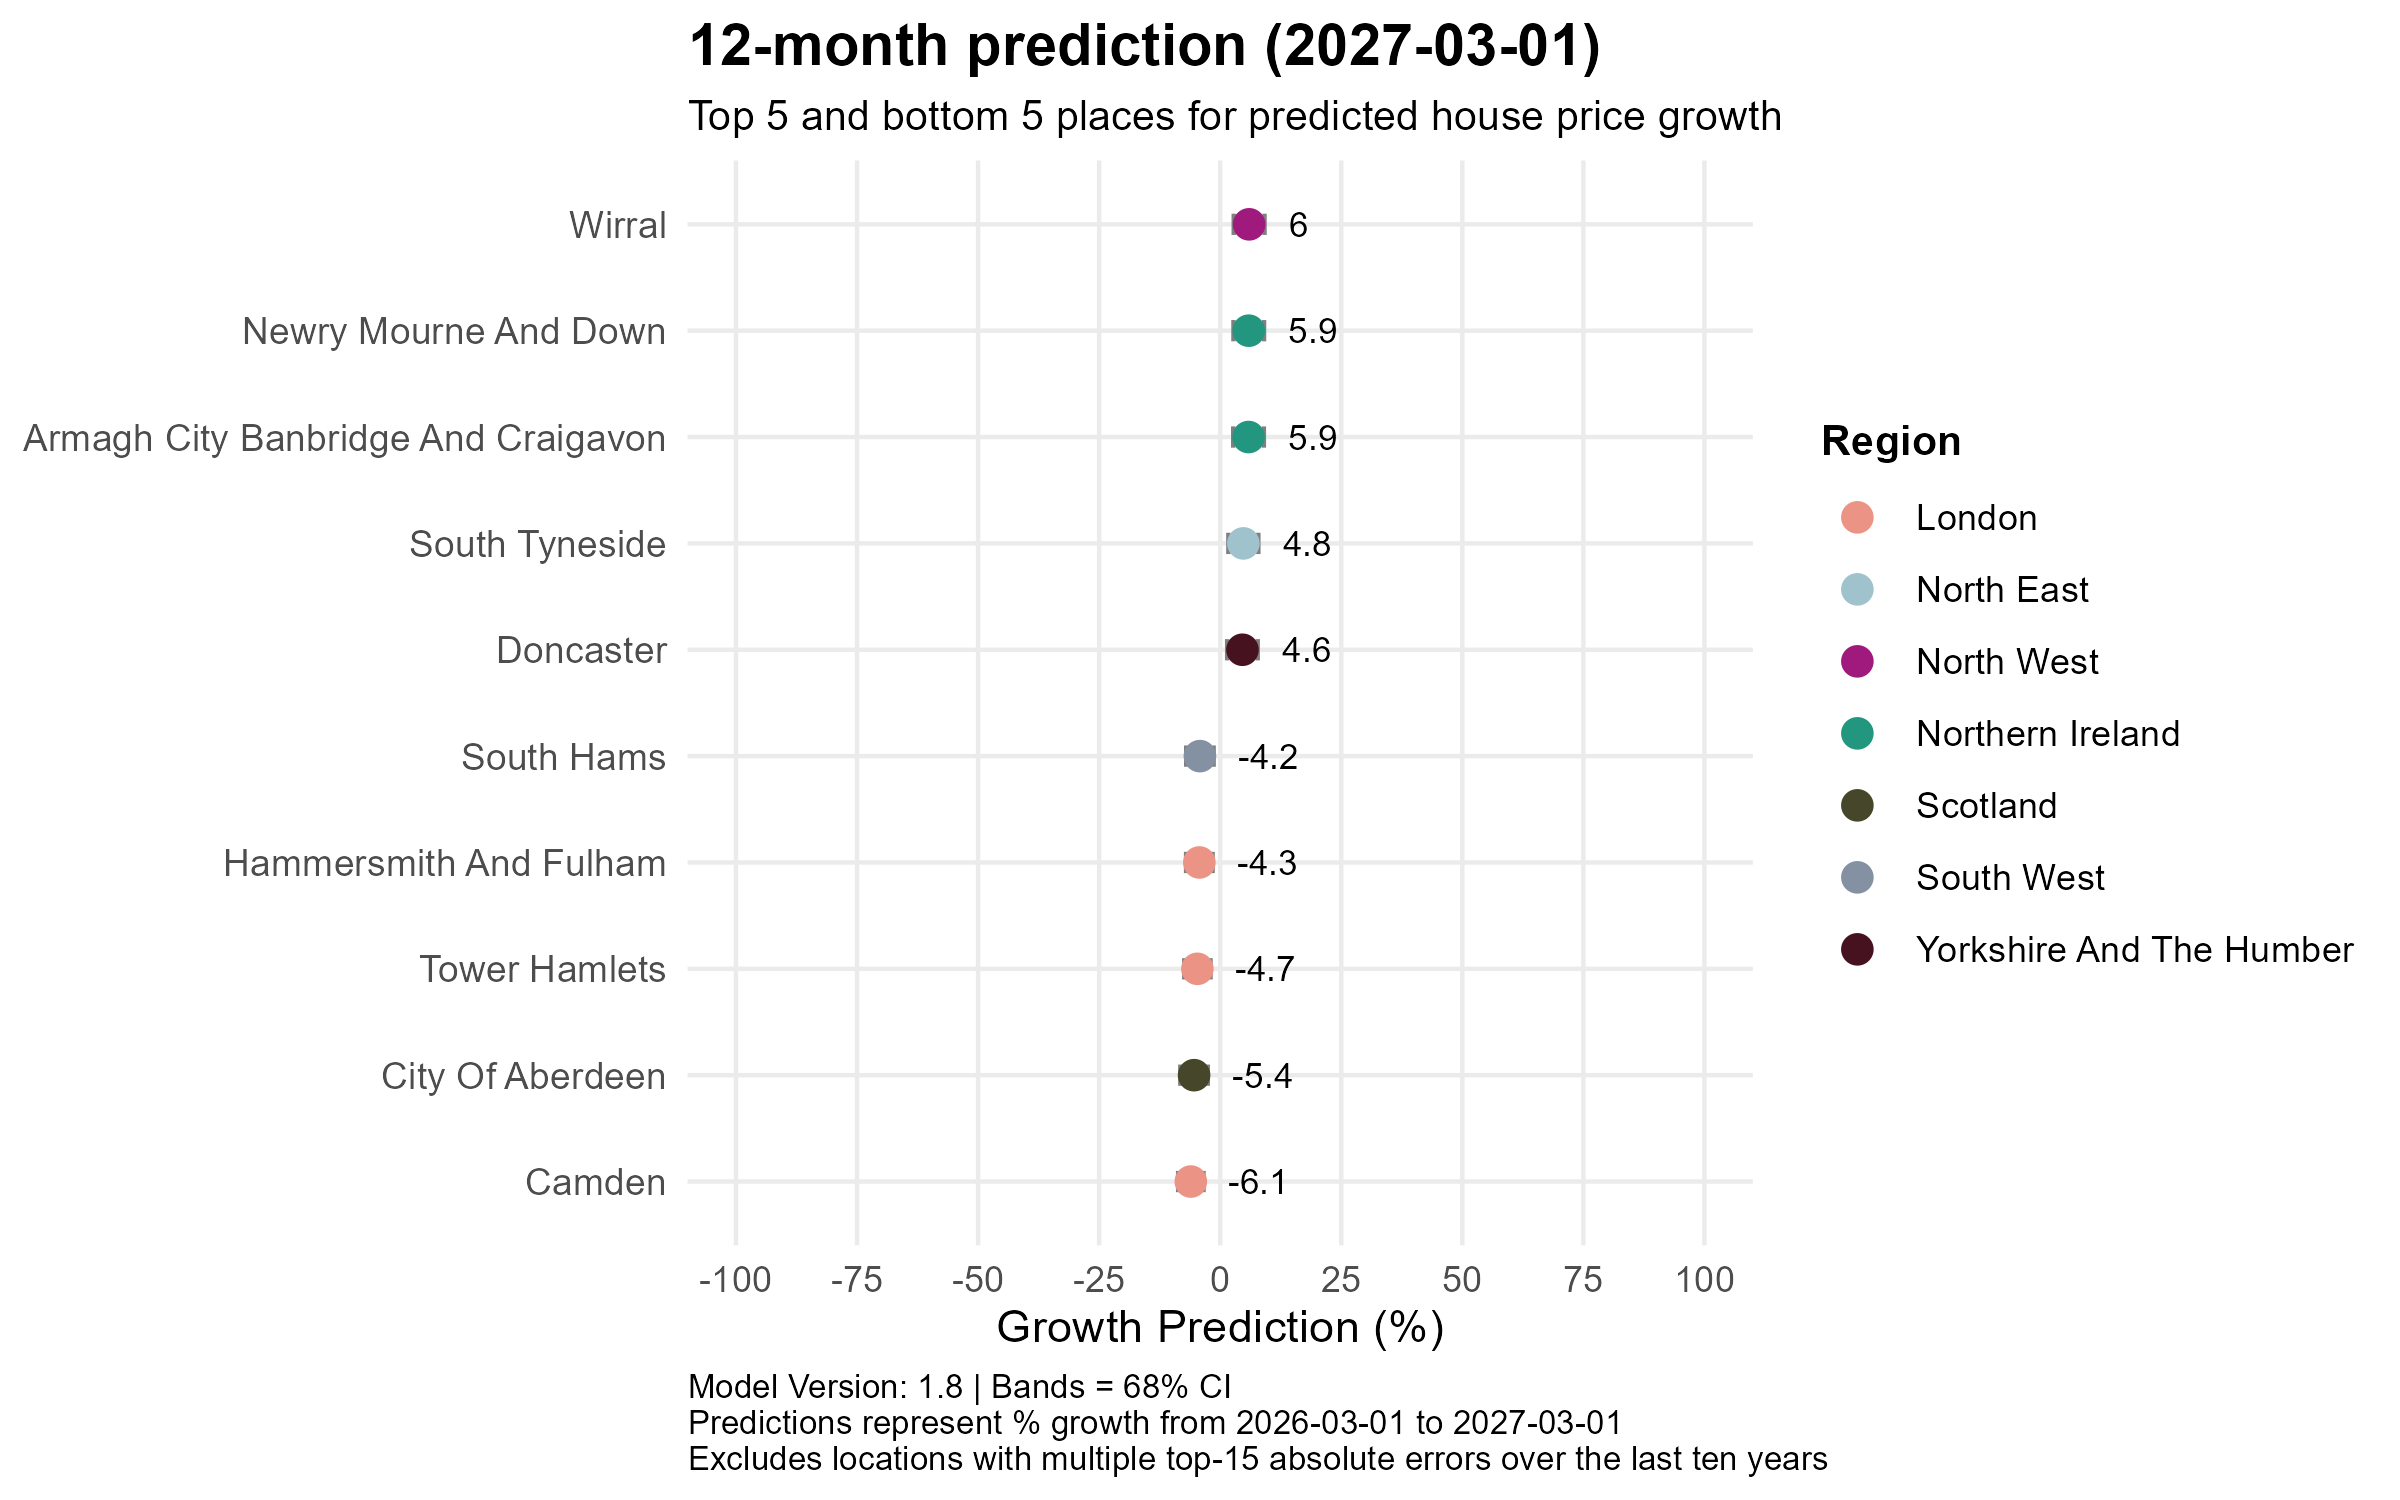
12-month prediction (to March 2027)
The short-term picture is dominated by Northern Ireland and the affordable North. Wirral in the North West leads the one-year predictions at +6.0%, closely followed by Newry Mourne and Down (+5.9%) and Armagh City Banbridge and Craigavon (+5.9%) in Northern Ireland, with South Tyneside (+4.8%) and Doncaster (+4.6%) rounding out the top five, a line-up drawn entirely from Merseyside, Northern Ireland, the North East and Yorkshire. The bottom five remain stubbornly London-centric: Camden is forecast to fall the most sharply at -6.1%, followed by City of Aberdeen (-5.4%), Tower Hamlets (-4.7%), Hammersmith and Fulham (-4.3%) and South Hams in Devon (-4.2%), though losses are notably more moderate than the current 12-month actuals suggest the worst of the correction may already be passing.
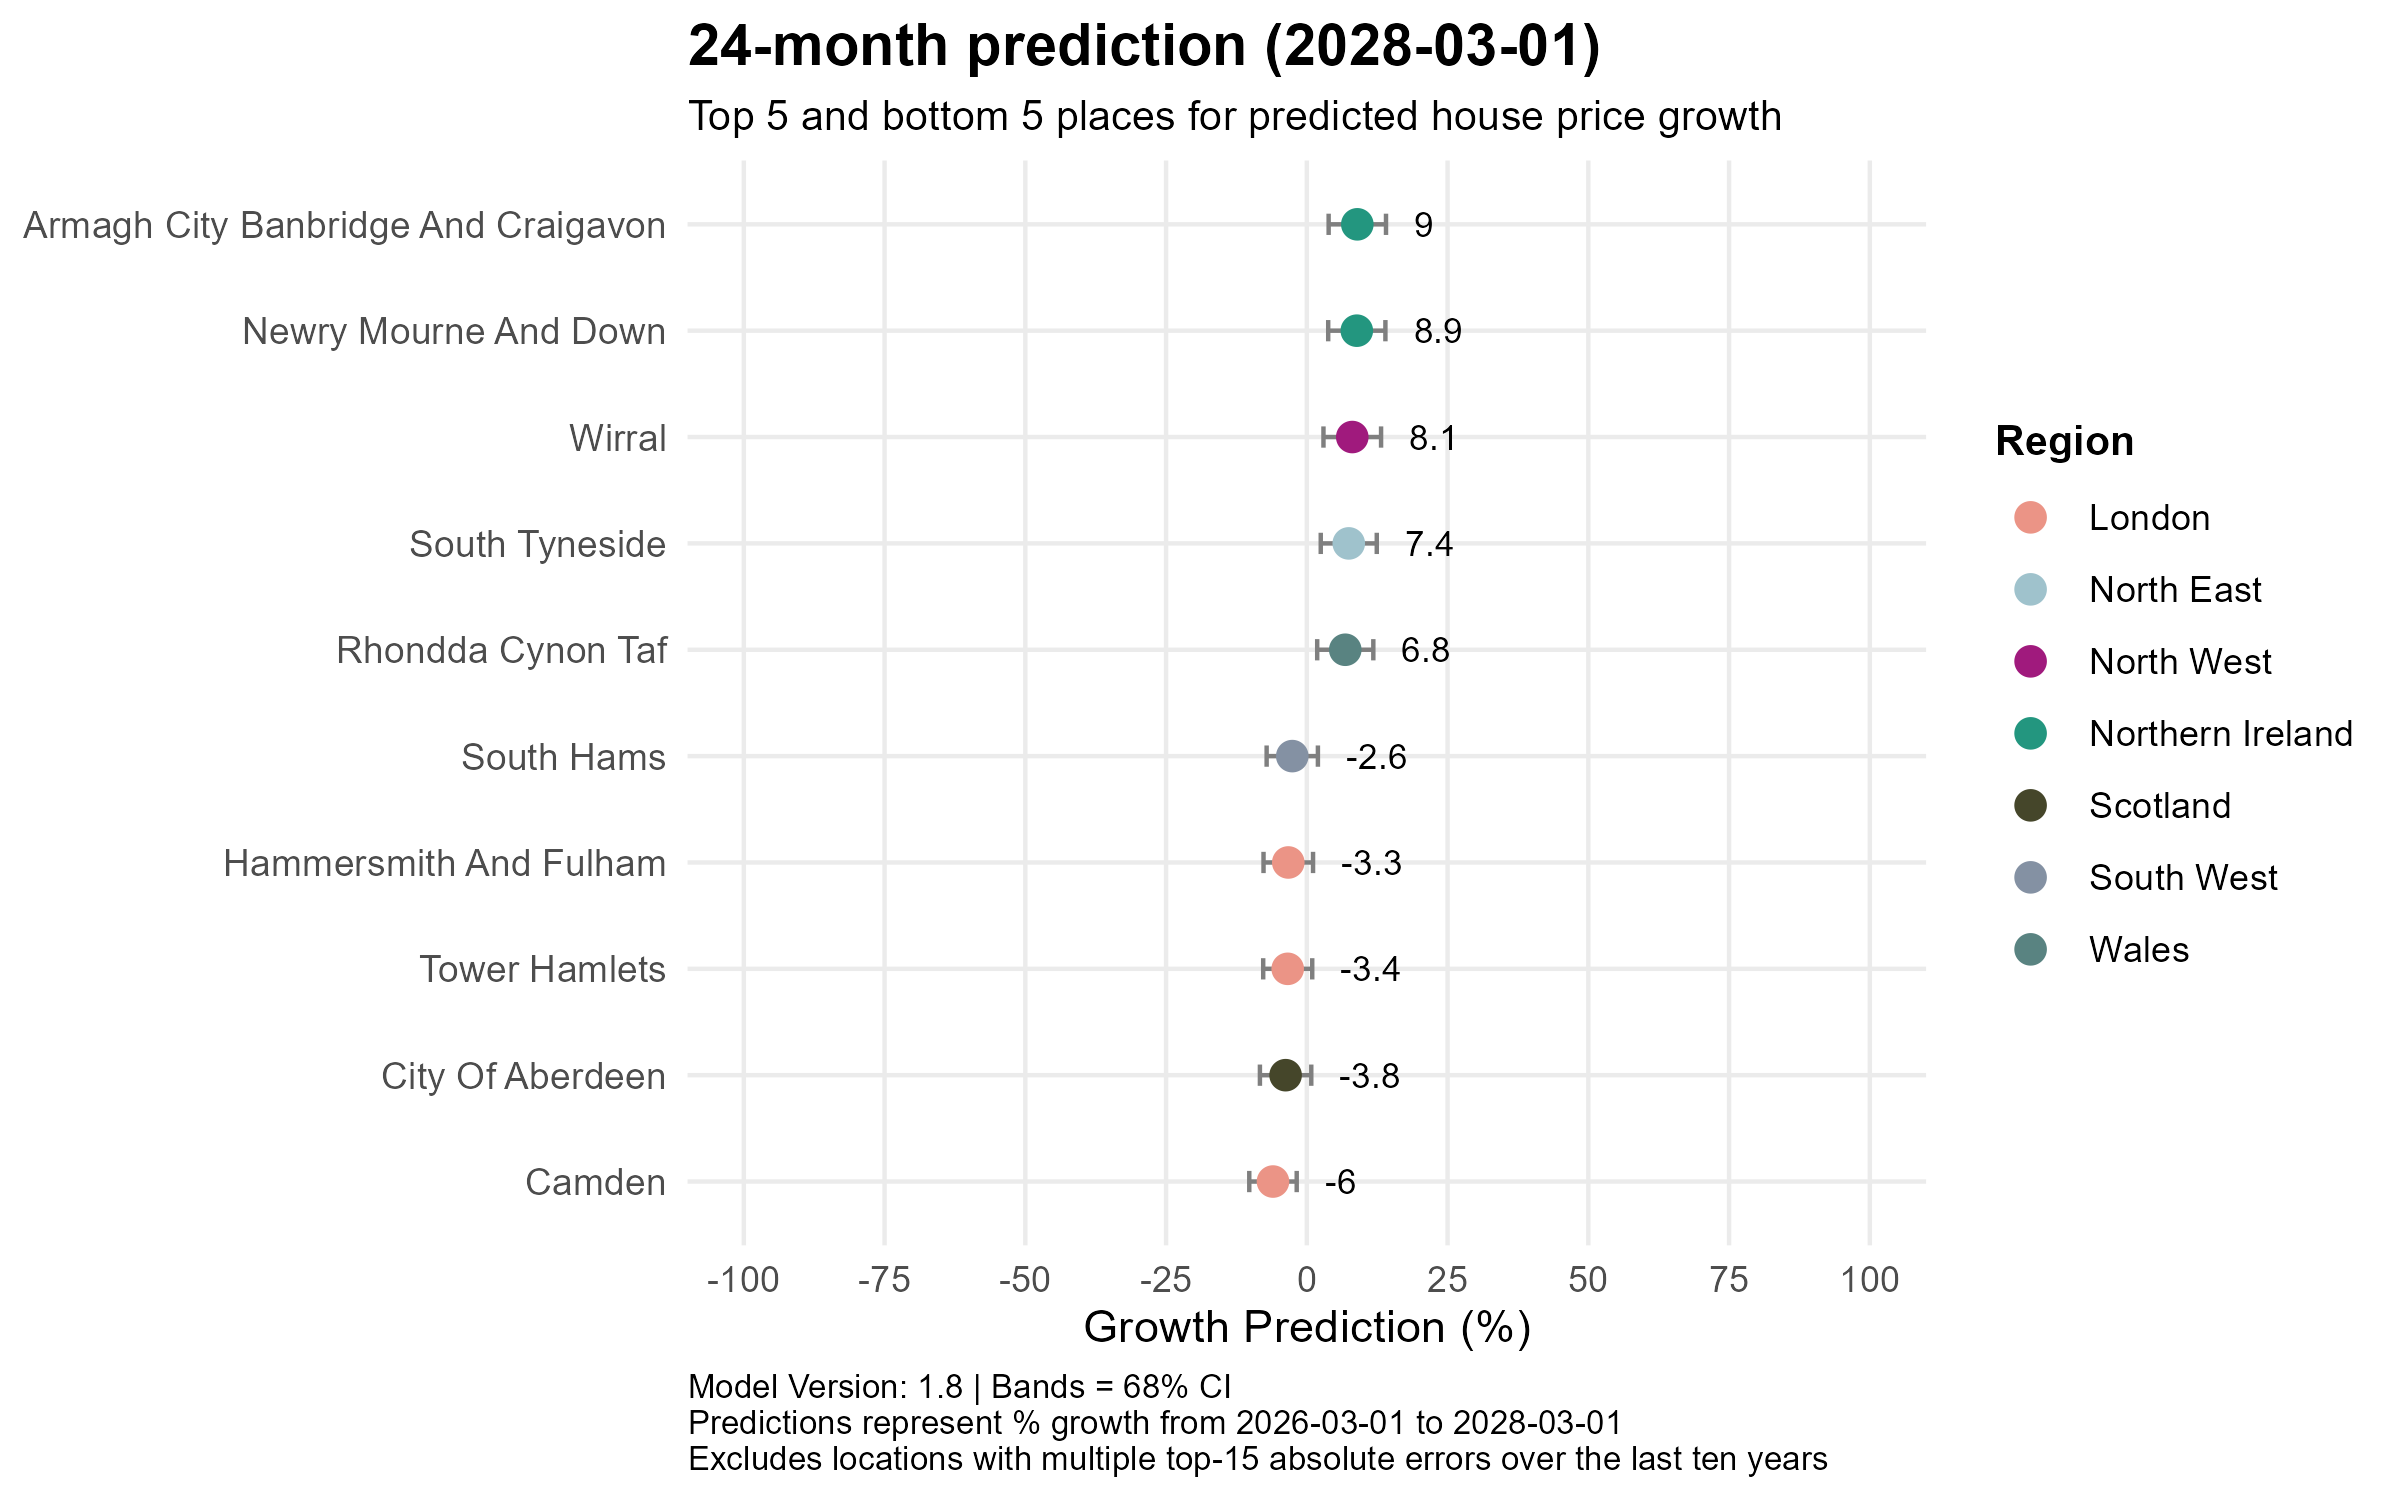
24-month prediction (to March 2028)
By the two-year horizon, Northern Ireland strengthens its grip at the top, with Armagh City Banbridge and Craigavon (+9.0%) and Newry Mourne and Down (+8.9%) leading, joined by Wirral (+8.1%), South Tyneside (+7.4%) and reflecting Wales’s improving momentum Rhondda Cynon Taf (+6.8%), marking its first appearance in the top five. The bottom five remain consistent: Camden (-6.0%), City of Aberdeen (-3.8%), Tower Hamlets (-3.4%), Hammersmith and Fulham (-3.3%) and South Hams (-2.6%), though the magnitude of the losses is moderating compared to the 12-month view, suggesting the worst pressures are beginning to ease in high-value southern markets.
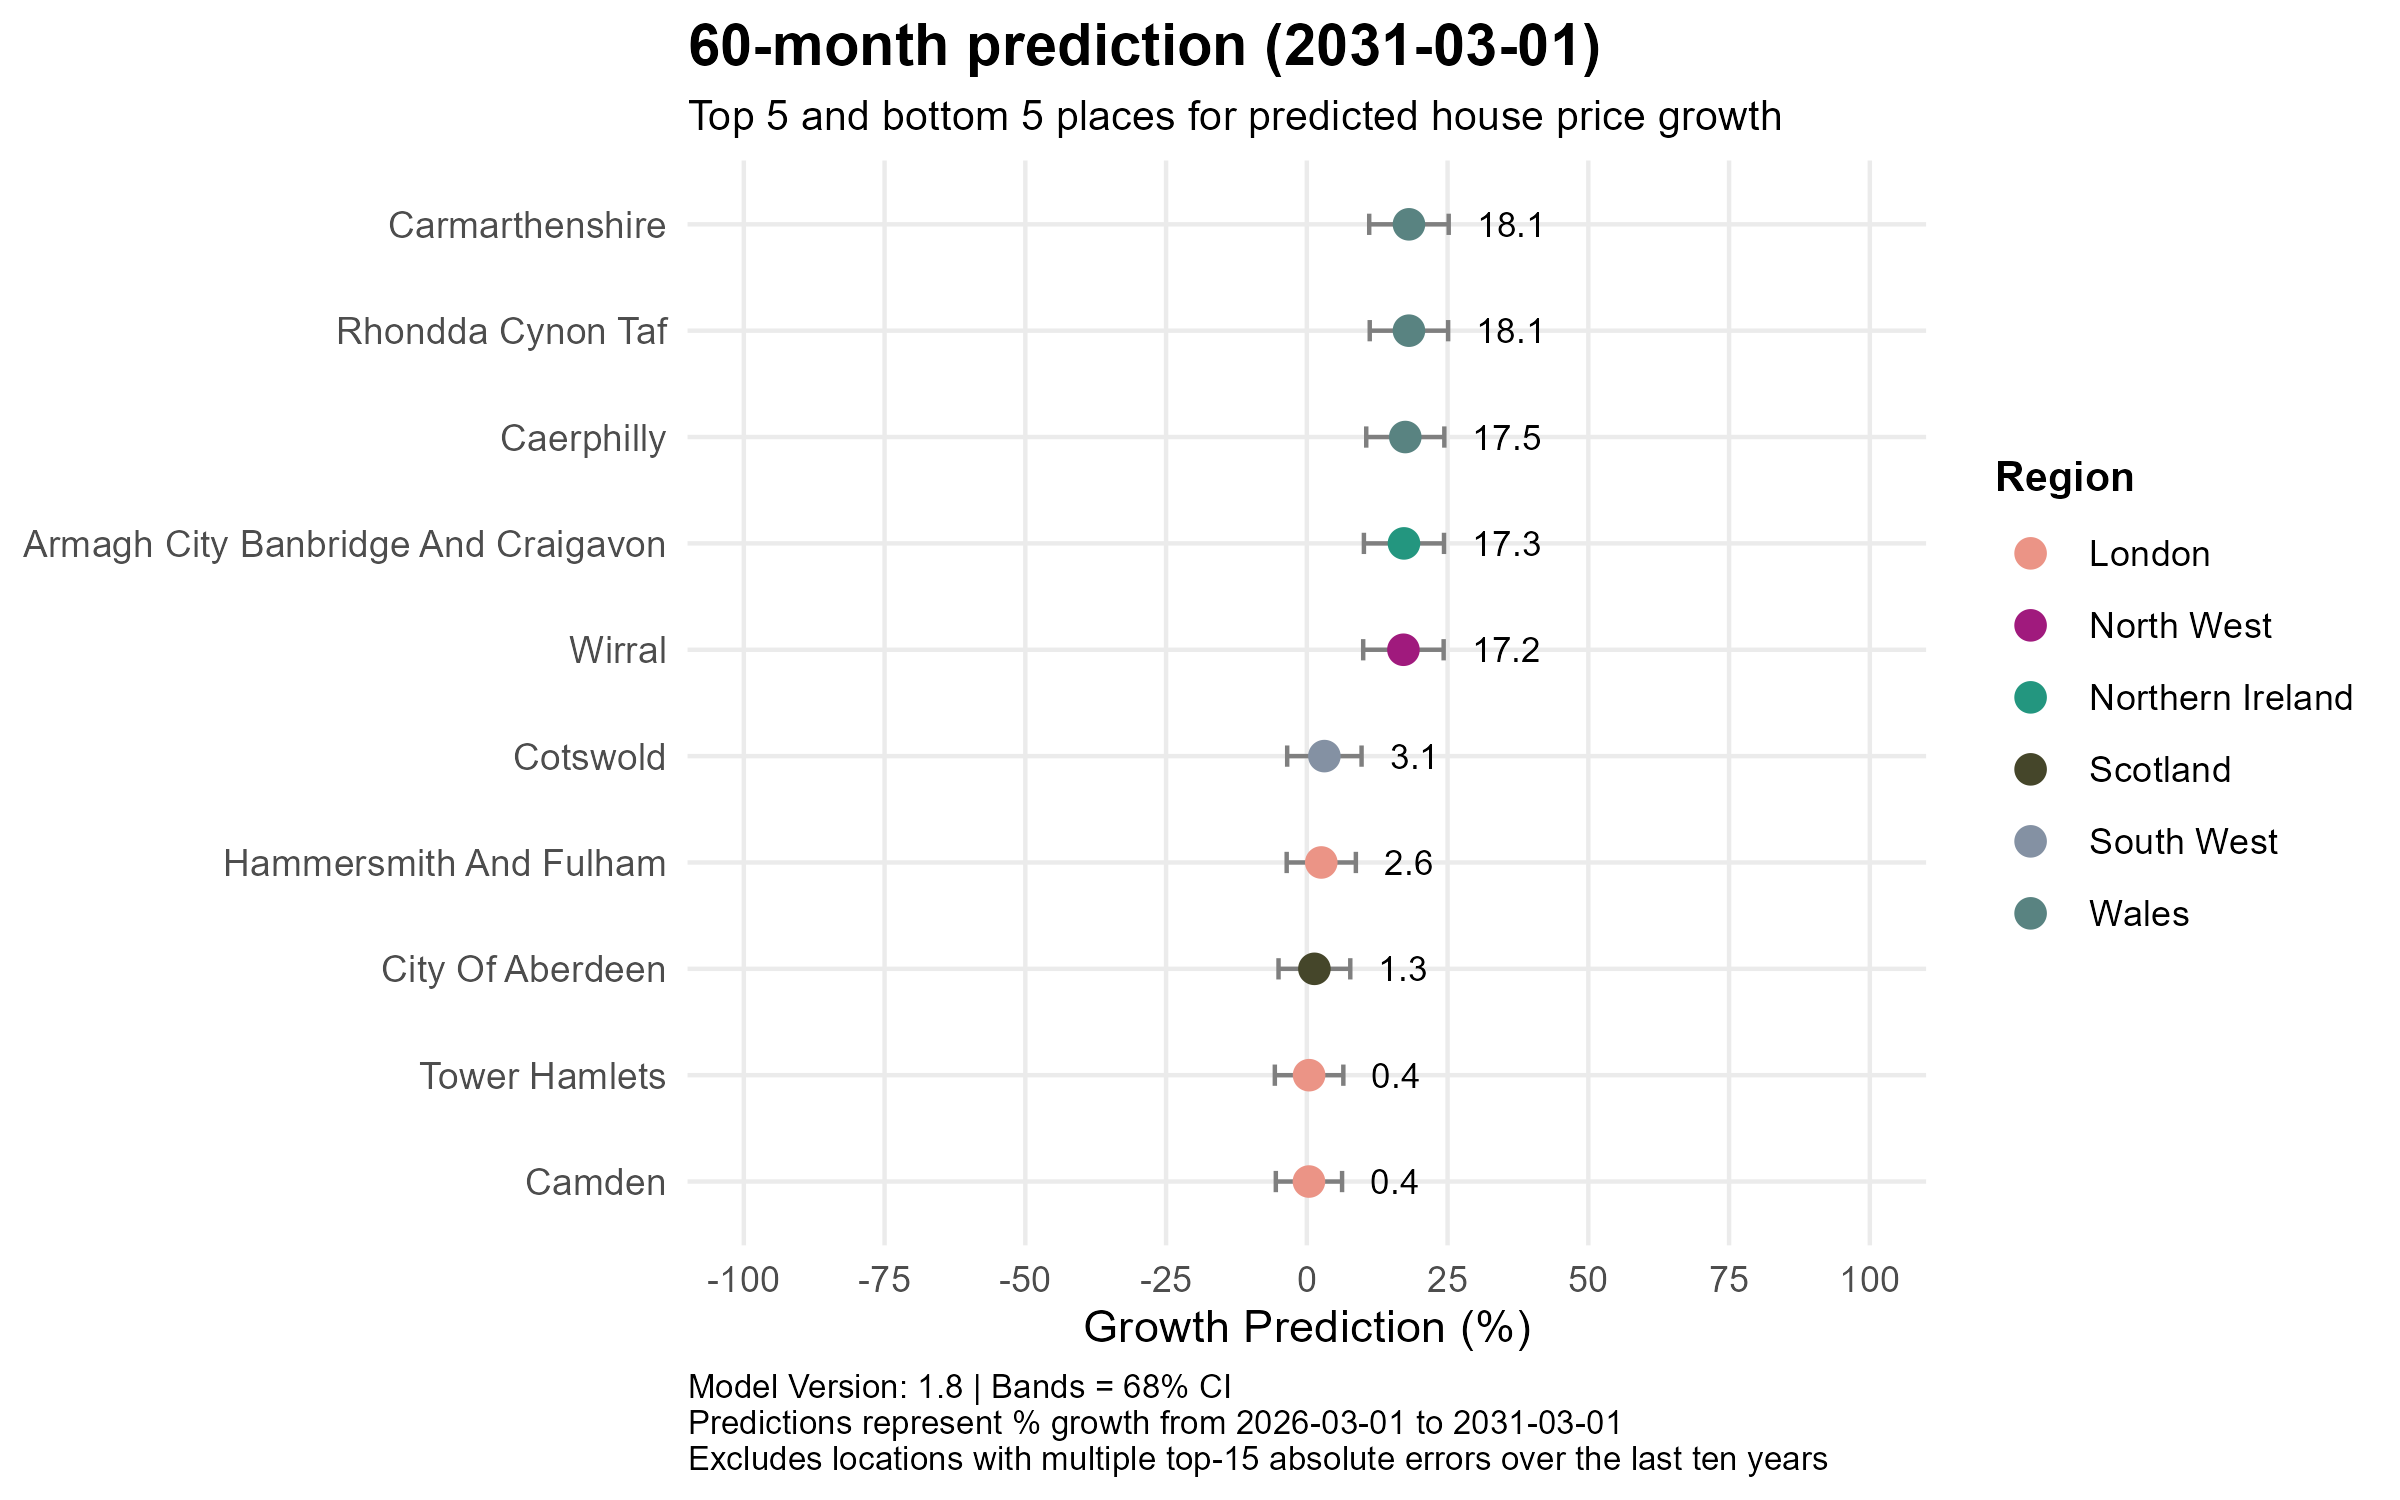
60-month prediction (to March 2031)
The five-year view brings a dramatic shift in composition, with Welsh authorities surging to the top of the leaderboard. Carmarthenshire and Rhondda Cynon Taf both top the rankings at +18.1%, joined by Caerphilly (+17.5%), all in Wales, alongside Armagh City Banbridge and Craigavon (+17.3%) in Northern Ireland and Wirral (+17.2%) in the North West. Crucially, even the long-term laggards are now forecast to post positive gains: Camden and Tower Hamlets both reach +0.4%, Hammersmith and Fulham +2.6%, and City of Aberdeen +1.3%, while Cotswold in the South West records +3.1%. The era of deeply negative London territory appears to be a short- to medium-term phenomenon rather than a structural one.
Conclusion
The overarching narrative this month is one of gradual rebalancing rather than crisis. Affordability remains the defining force reshaping the UK property market, with Northern Ireland, Wales, the North West and parts of the North East consistently leading across all time horizons, whilst London and pockets of the South continue to face a correction that is, encouragingly, beginning to moderate by the medium term. Nationally, the model points to a brief near-term pause before resuming its upward path to £305k by 2031. This pattern echoes last month’s post, and the consistency across model updates lends confidence to the underlying direction of travel — no boom, but no structural collapse either.

Leave a comment