
Economic summary
News
Over the past month the UK backdrop has been one of cautious improvement with nagging price pressures: the Bank of England trimmed Bank Rate by 0.25pp to 4% on 7 August, citing progress in underlying disinflation, even as July CPI re-accelerated to 3.8% and CPIH to 4.2% on dearer air fares and fuel.
Activity looks patchy: GDP rose 0.4% in June, while the August flash PMI hit a 12-month high (Composite 53.0) on services strength even as manufacturing stayed in contraction.
The labour market continues to loosen — unemployment edged up to 4.7% in April–June and vacancies fell — helping cool pay growth. Public finances offered a small respite, with borrowing in July just £1.1bn, below the OBR’s March forecast. Against this blend of lower rates, sticky services inflation and softer hiring, housing-adjacent indicators are mixed:
Indicators
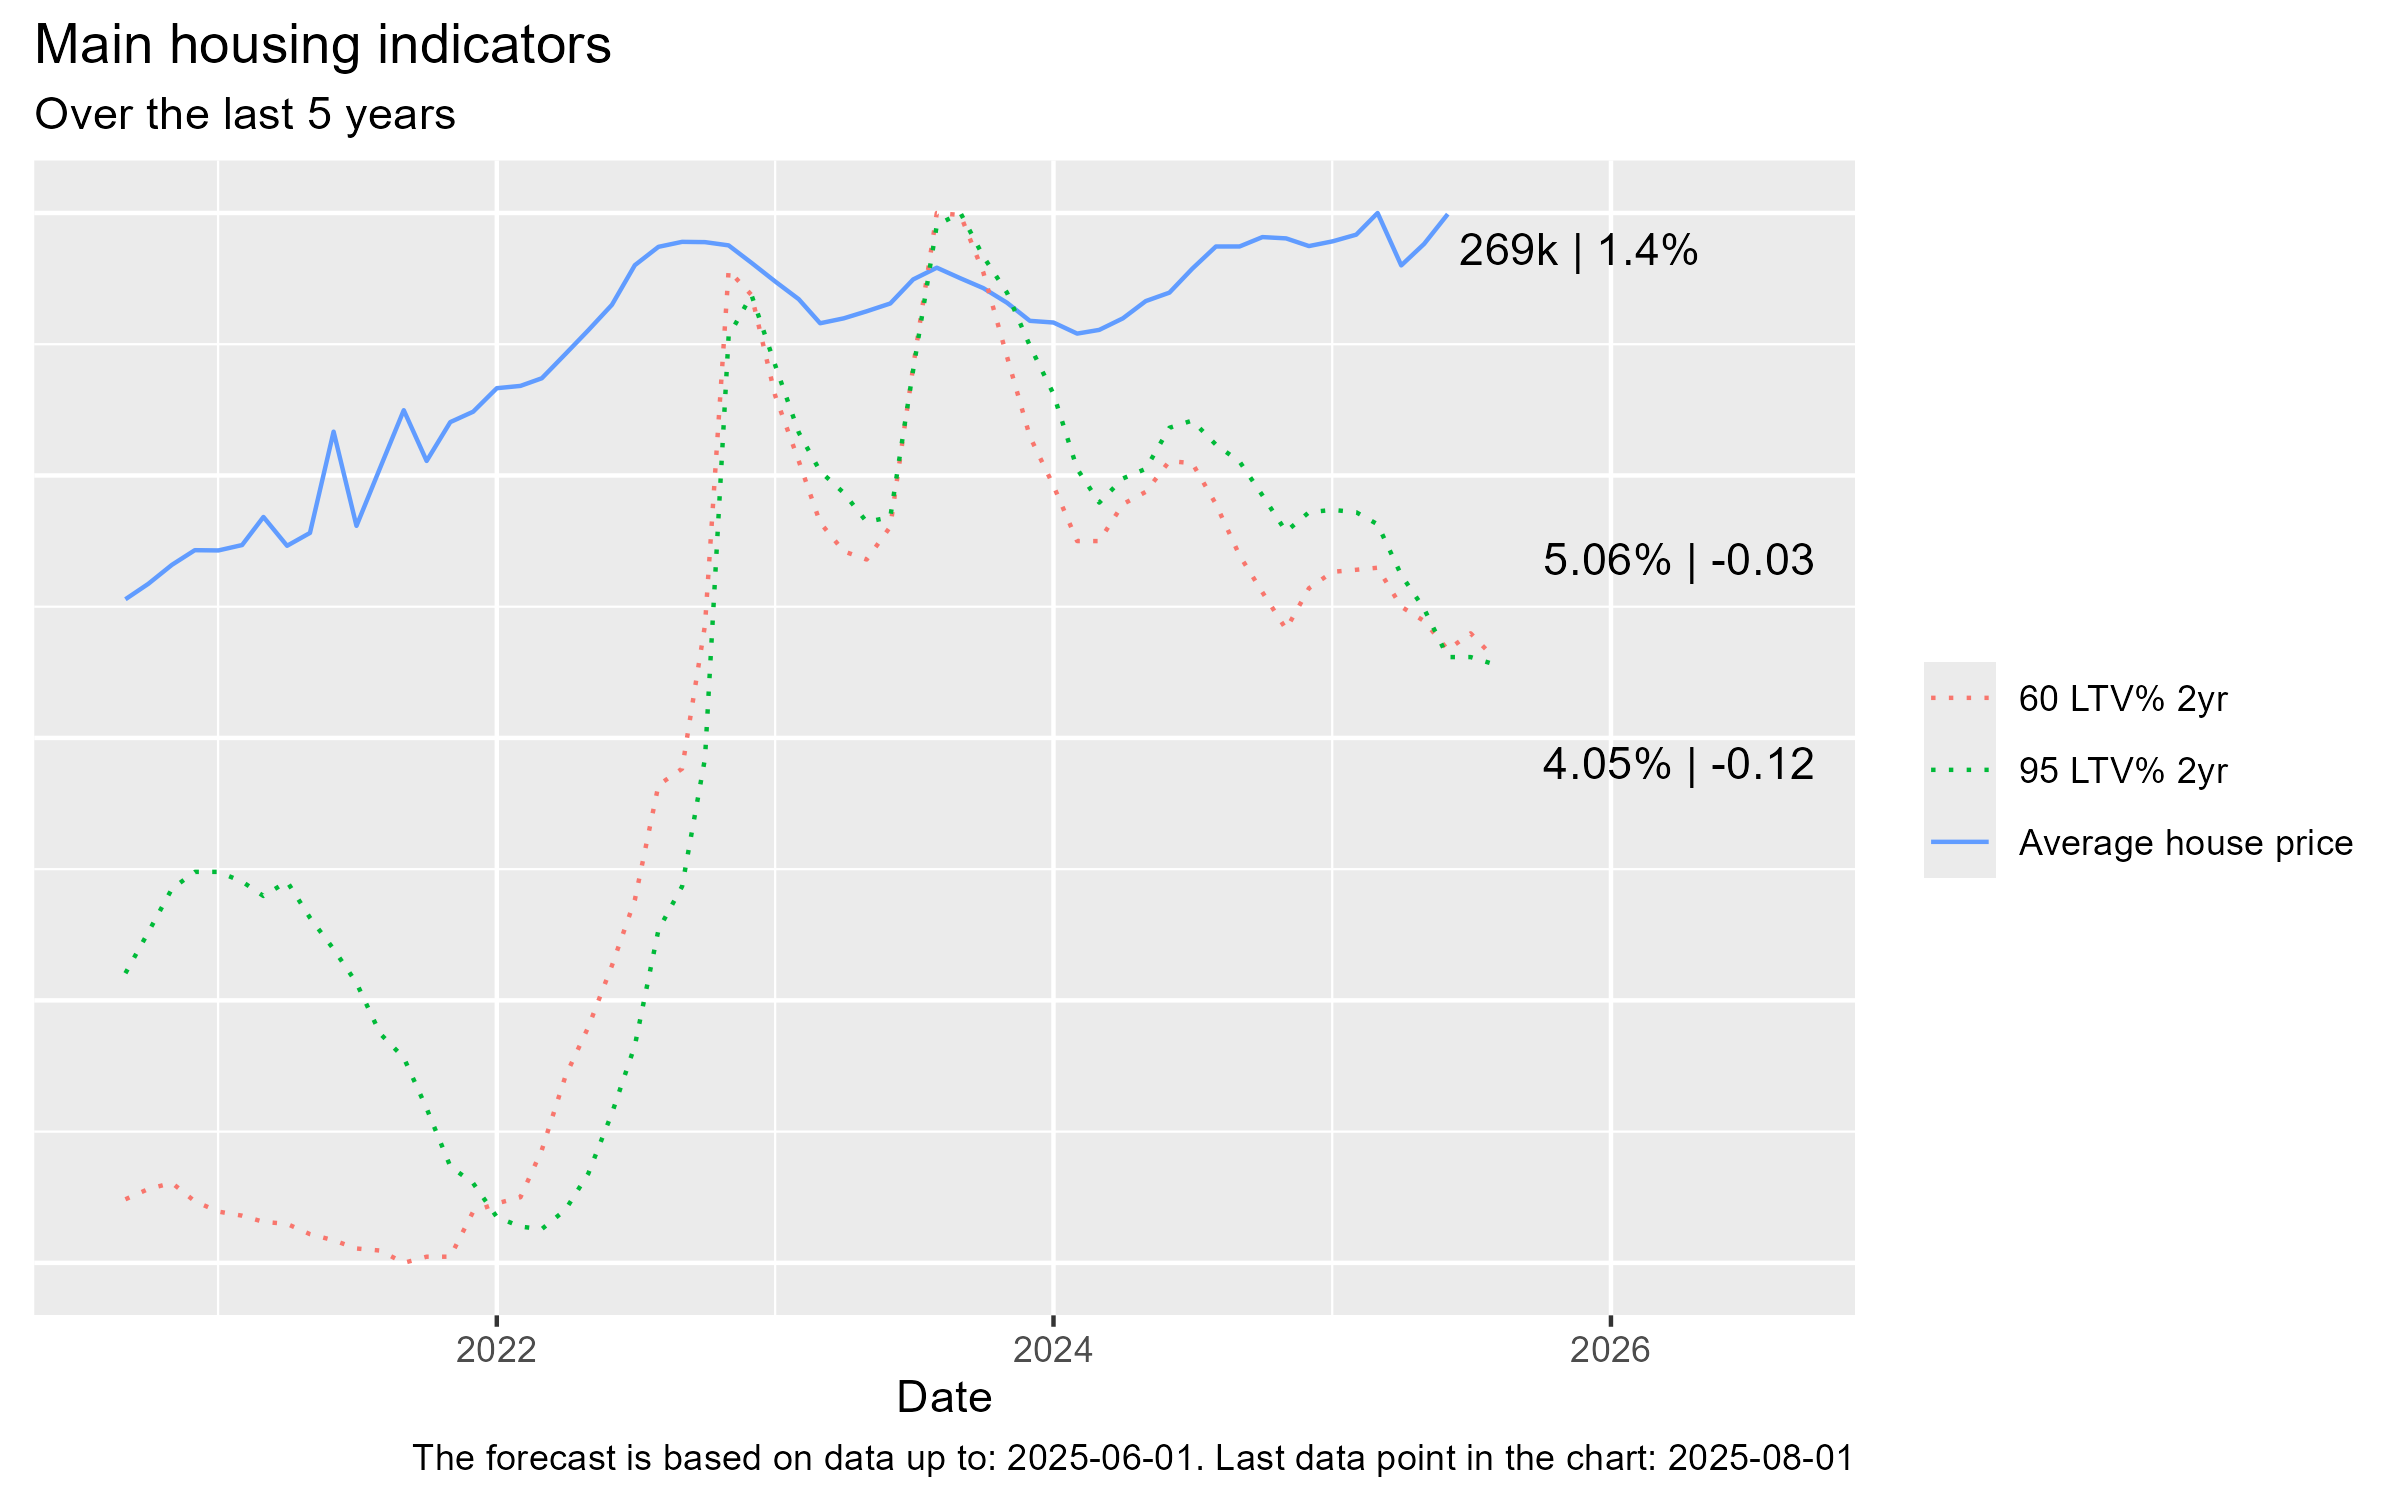
- Average house prices increased slightly, though still held steady at £269k
- Mortgage rates for 60 % LTV and 95 % LTV have both decreased on the previous month
Current growth rates
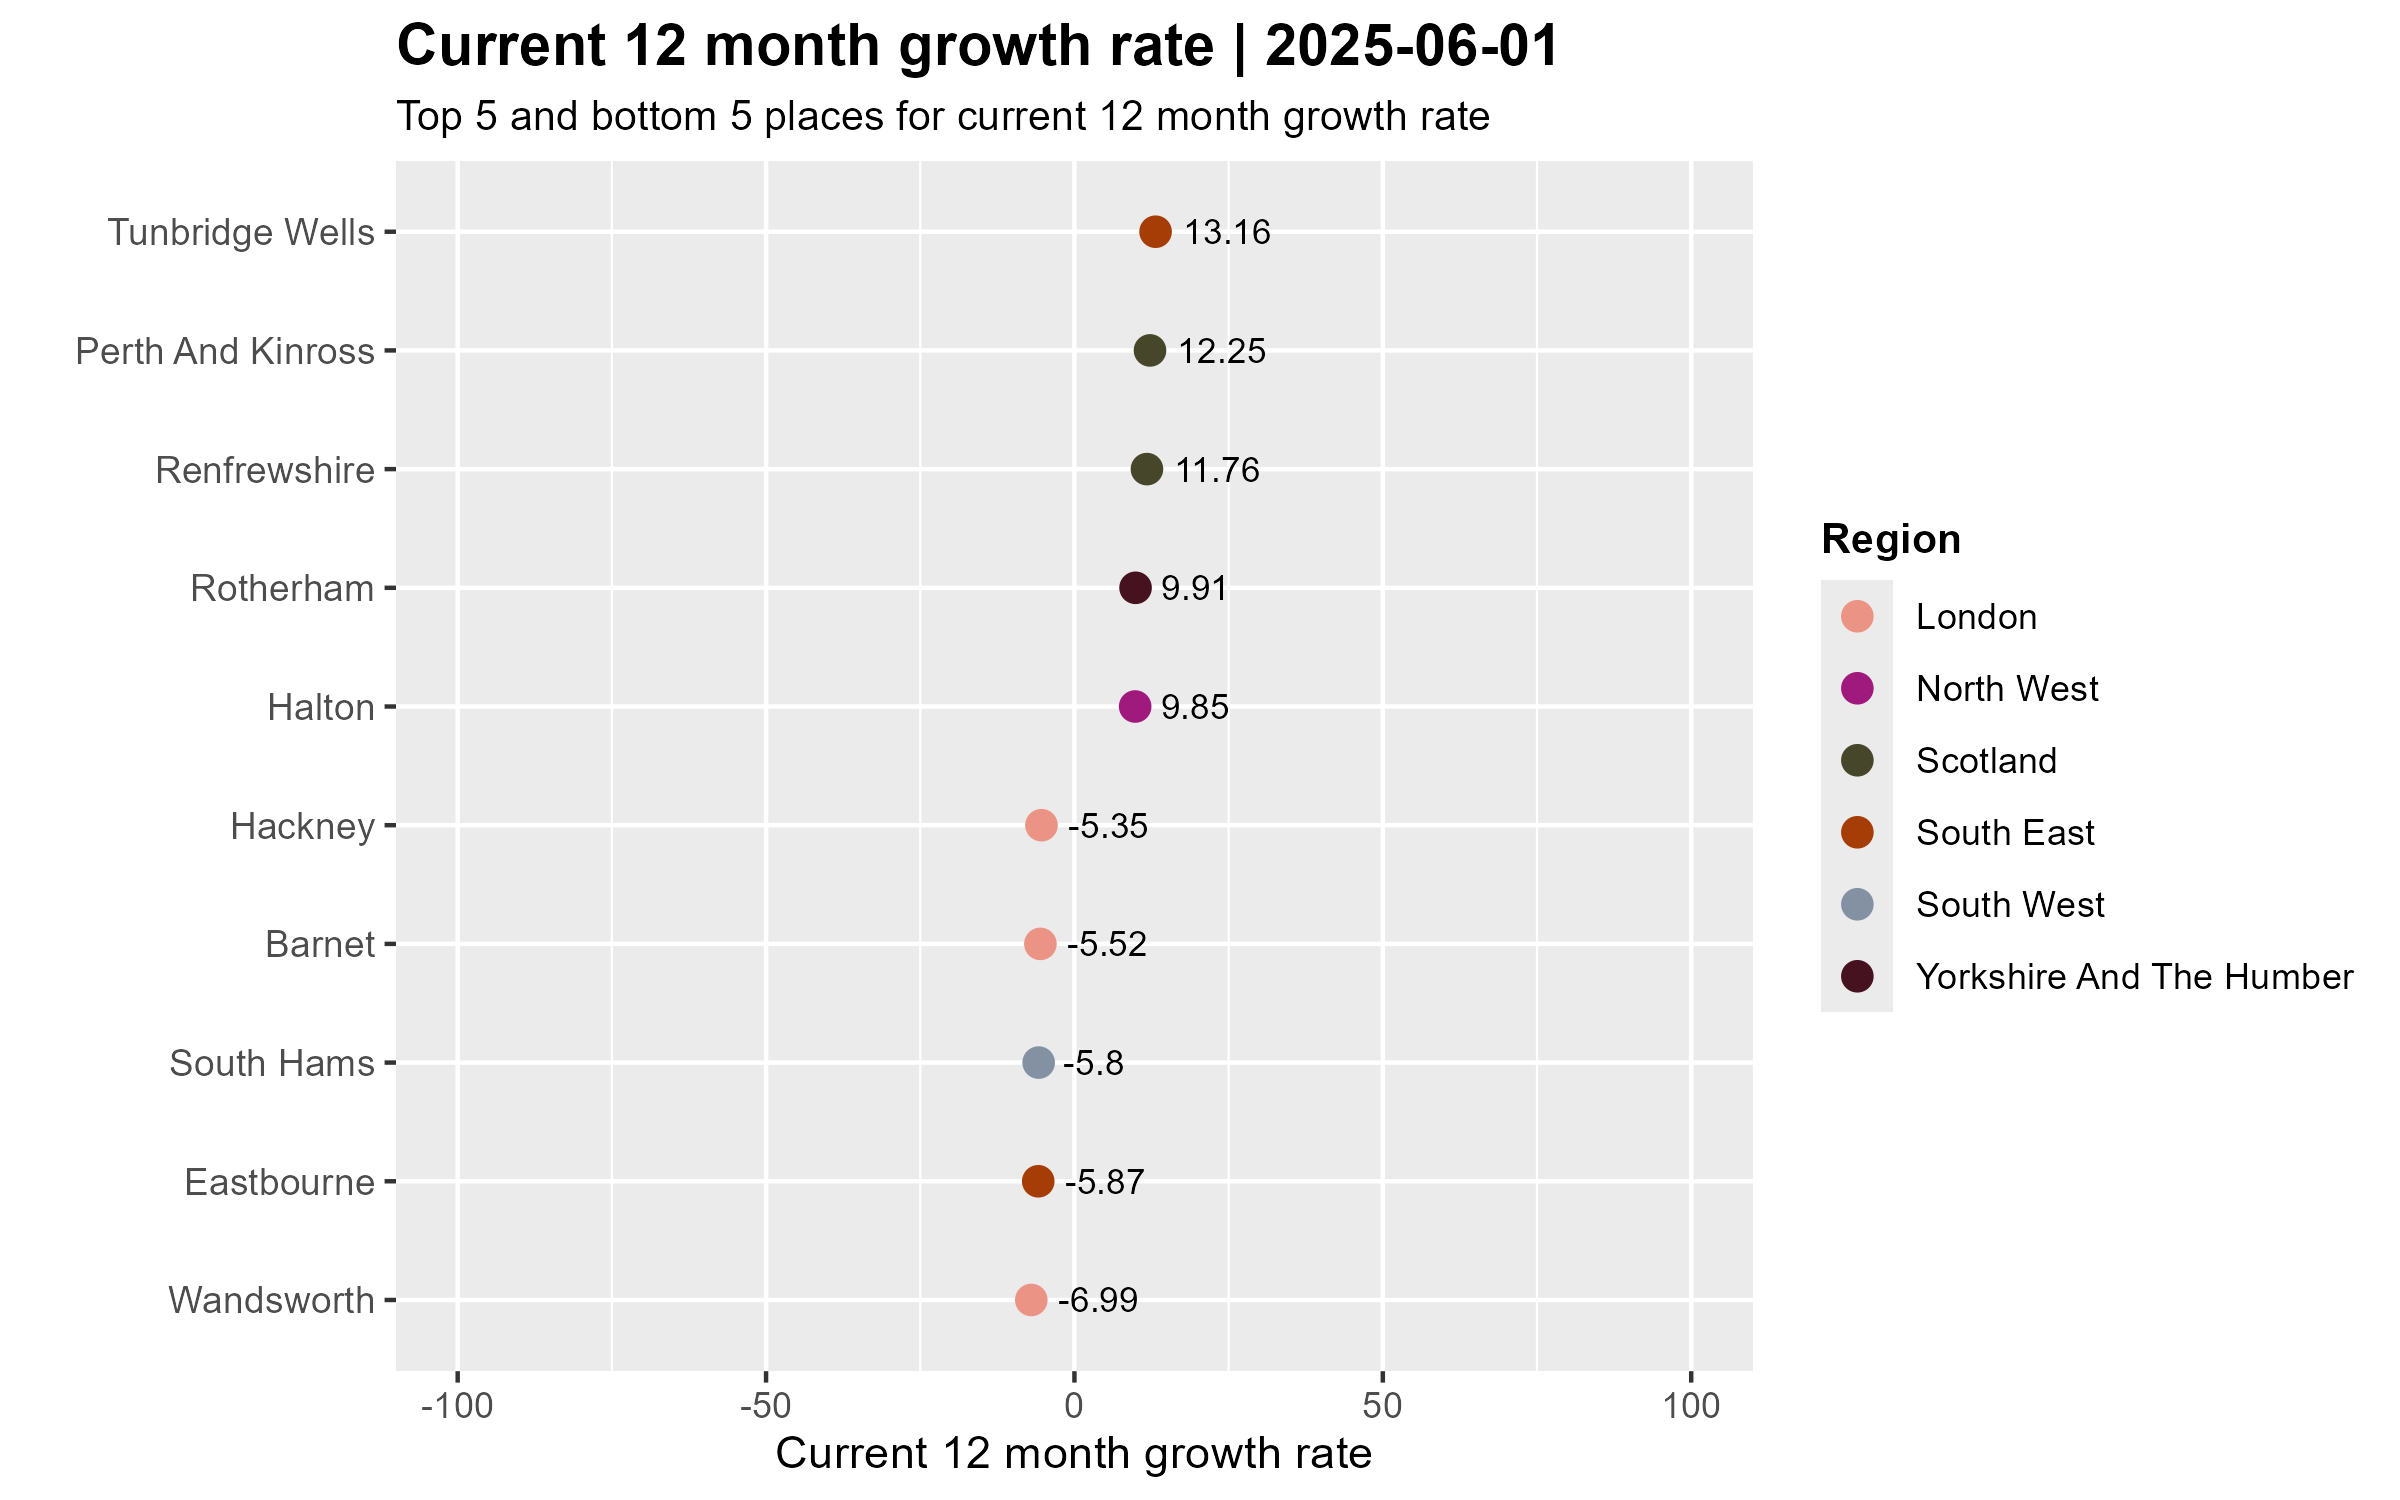
Over the year to June 2025, price momentum is skewed towards Scotland and selected towns outside the big cities: Tunbridge Wells leads at +13.16% (a South-East exception), followed by Perth & Kinross (+12.25%), Renfrewshire (+11.76%), Rotherham (+9.91%) and Halton (+9.85%). At the other end, London and southern coastal/rural markets are softening: Wandsworth (–6.99%) is weakest, with Eastbourne (–5.87%), South Hams (–5.80%), Barnet (–5.52%) and Hackney (–5.35%) also in decline. The near 20.2-ppt gap between best and worst underlines a market tilting towards more affordable regional areas while pricier London and southern locations continue to drift.
Predictions
Overall
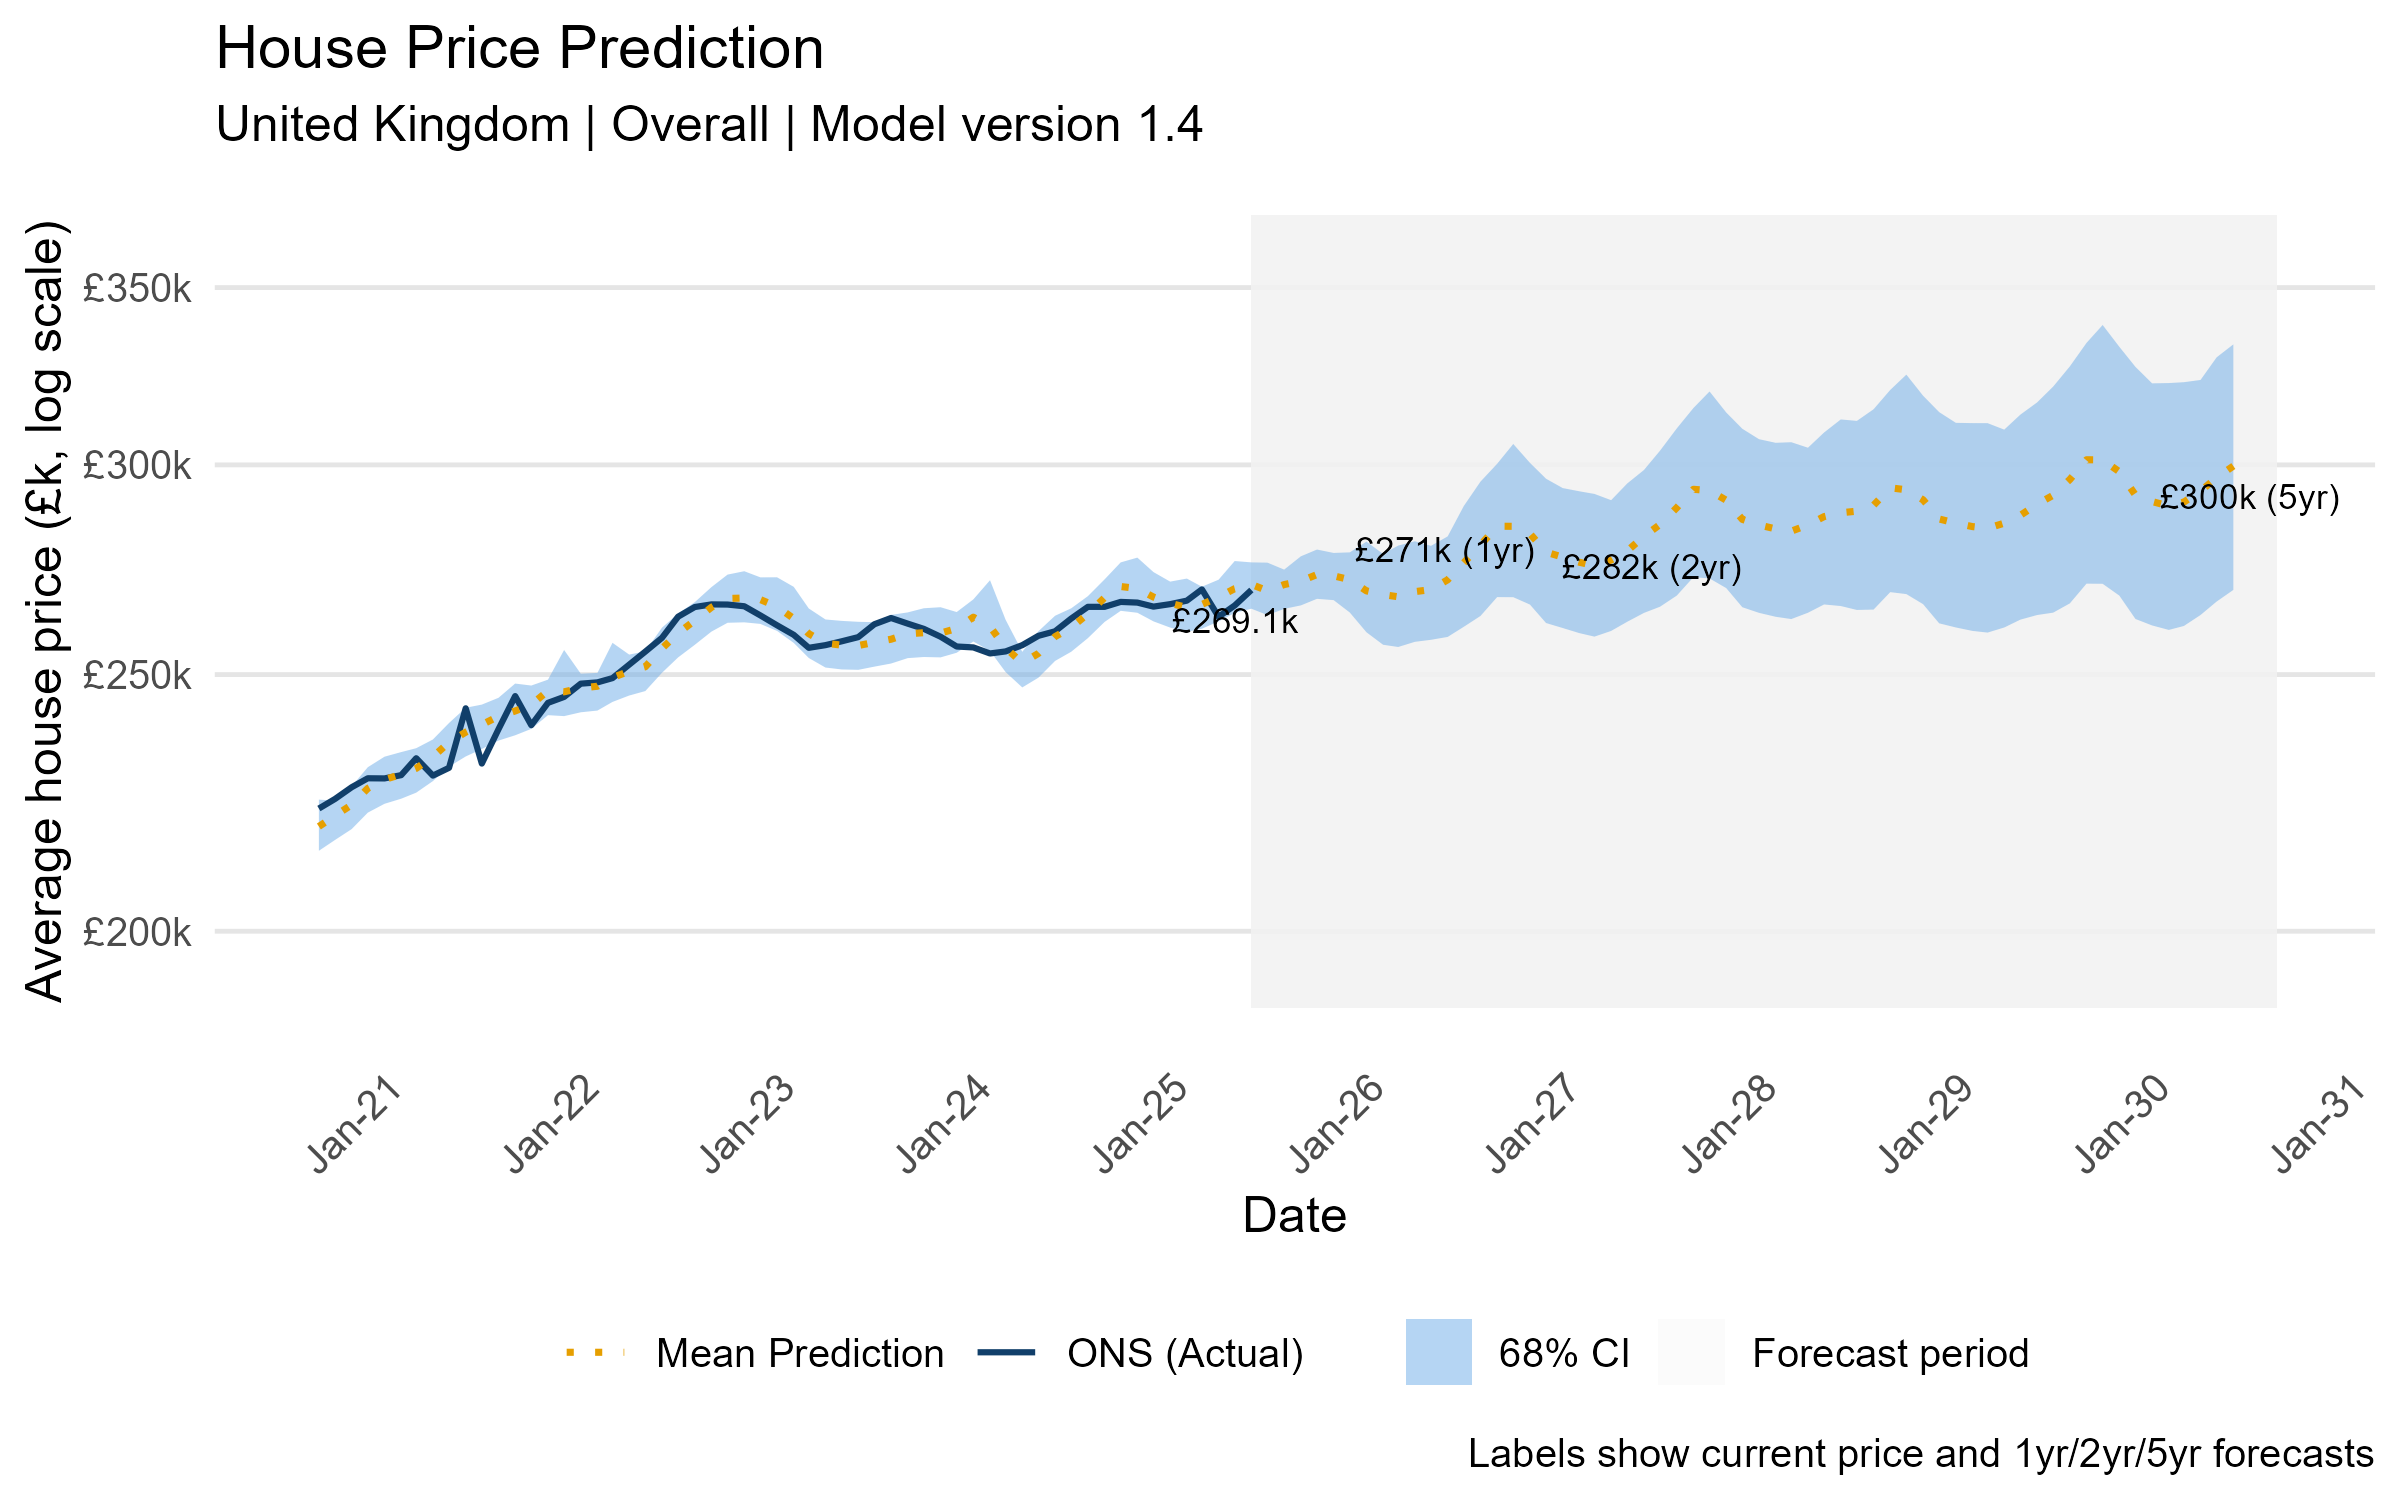
The model suggests only modest nominal growth in UK house prices, edging up from the current c. £269k to roughly £271k in one year and £282k in two years, before reaching about £300k in five years.
Regional
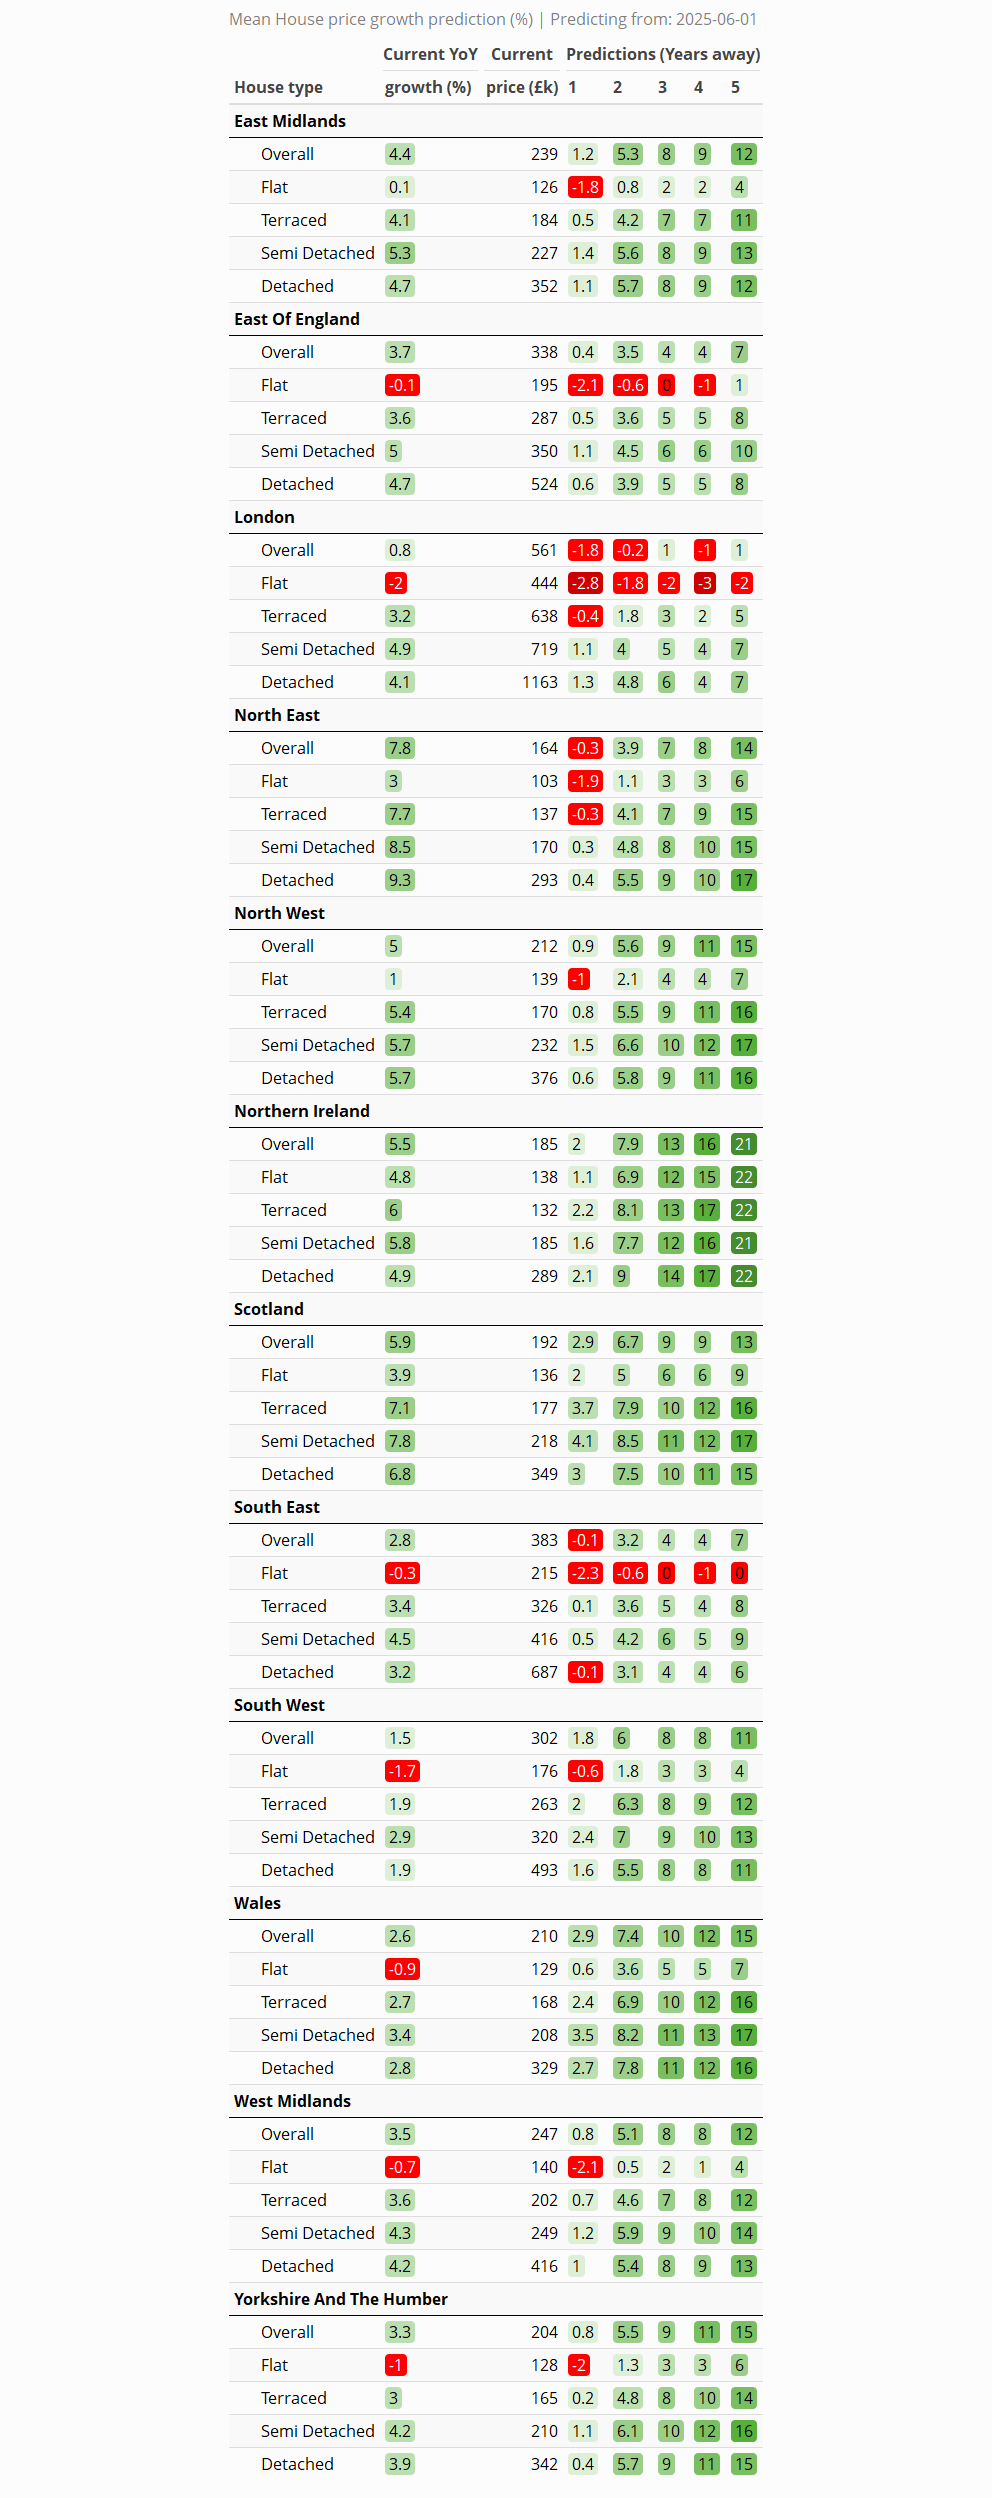
Short term (1 year): Most regions are flat-to-mildly positive, led by Wales (c. 2.9 per cent), Scotland (c. 2.9 per cent) and Northern Ireland (c. 2.0 per cent), with the Midlands and North West also nudging up. Laggards are London (c. –1.8 per cent), the South East (c. –0.1 per cent) and the North East (c. –0.3 per cent), underscoring softness in higher-cost southern markets.
Medium term (2–3 years): Growth broadens, led by Northern Ireland (c. 7.9 per cent at two years; c. 13.0 per cent at three), Wales (c. 7.4 per cent; c. 10.0 per cent), the North West (c. 5.6 per cent; c. 9.0 per cent) and Scotland (c. 6.7 per cent; c. 9.0 per cent), with the North East improving (c. 3.9 per cent; c. 7.0 per cent). By contrast, London barely advances (c. –0.2 per cent; c. 1.0 per cent) and the South East/East of England remain subdued (c. 4.0 per cent by year three).
Long term (4–5 years): By year five the strongest cumulative gains are in Northern Ireland (c. 21 per cent), with North West, Wales and Yorkshire & the Humber each around (c. 15 per cent); Scotland is (c. 13 per cent) and the East/West Midlands (c. 12 per cent). The South West sits near (c. 11 per cent), the South East and East of England around (c. 7 per cent), while London remains the clear underperformer (c. –1 per cent at year four; c. 1 per cent by year five).
Local
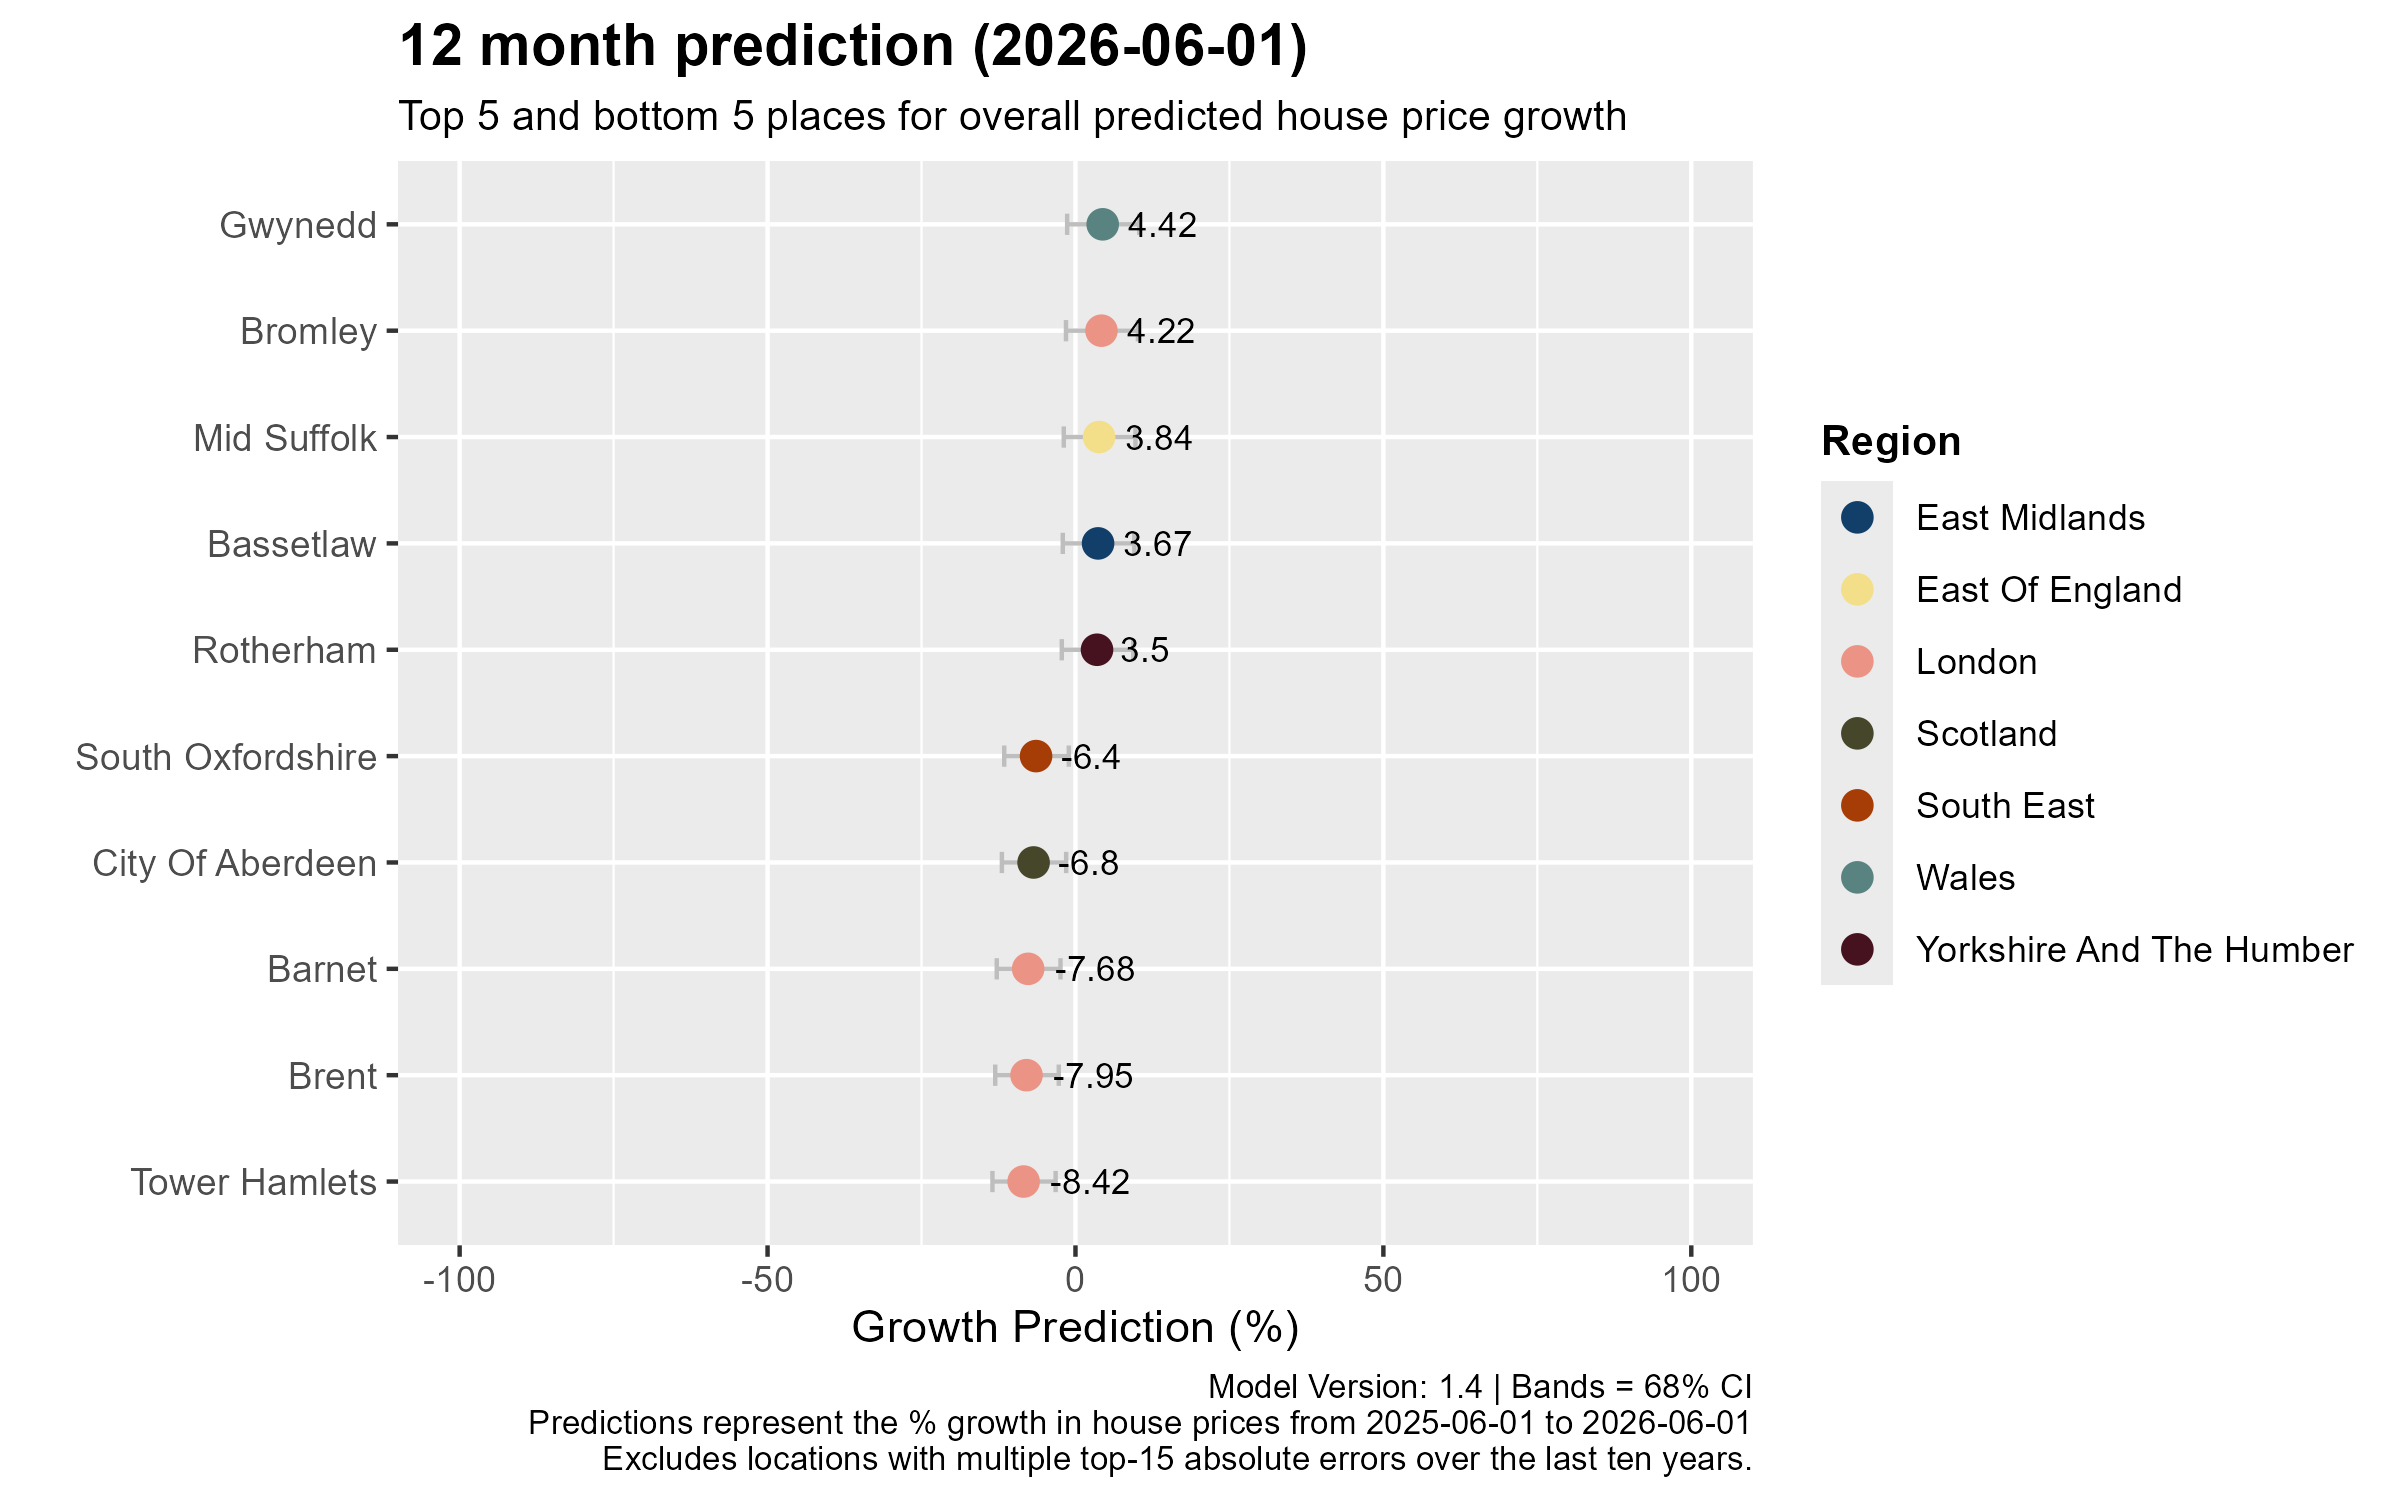
For the next 12 months, the model’s leaders are Gwynedd (Wales, c. 4.42 per cent), Bromley (London, c. 4.22 per cent), Mid Suffolk (East of England, c. 3.84 per cent), Bassetlaw (East Midlands, c. 3.67 per cent) and Rotherham (Yorkshire and The Humber, c. 3.50 per cent).
At the other end, the weakest are Tower Hamlets (London, c. –8.42 per cent), Brent (London, c. –7.95 per cent), Barnet (London, c. –7.68 per cent), the City of Aberdeen (Scotland, c. –6.80 per cent) and South Oxfordshire (South East, c. –6.40 per cent).
This profile shows sharp dispersion—roughly 12.8 percentage points between best and worst—with declines concentrated in several London boroughs, while gains are spread across more affordable regional markets (plus an outer-London outlier in Bromley); the confidence bands are modest, but still suggest that the downside risks are skewed towards the southern high-cost areas.
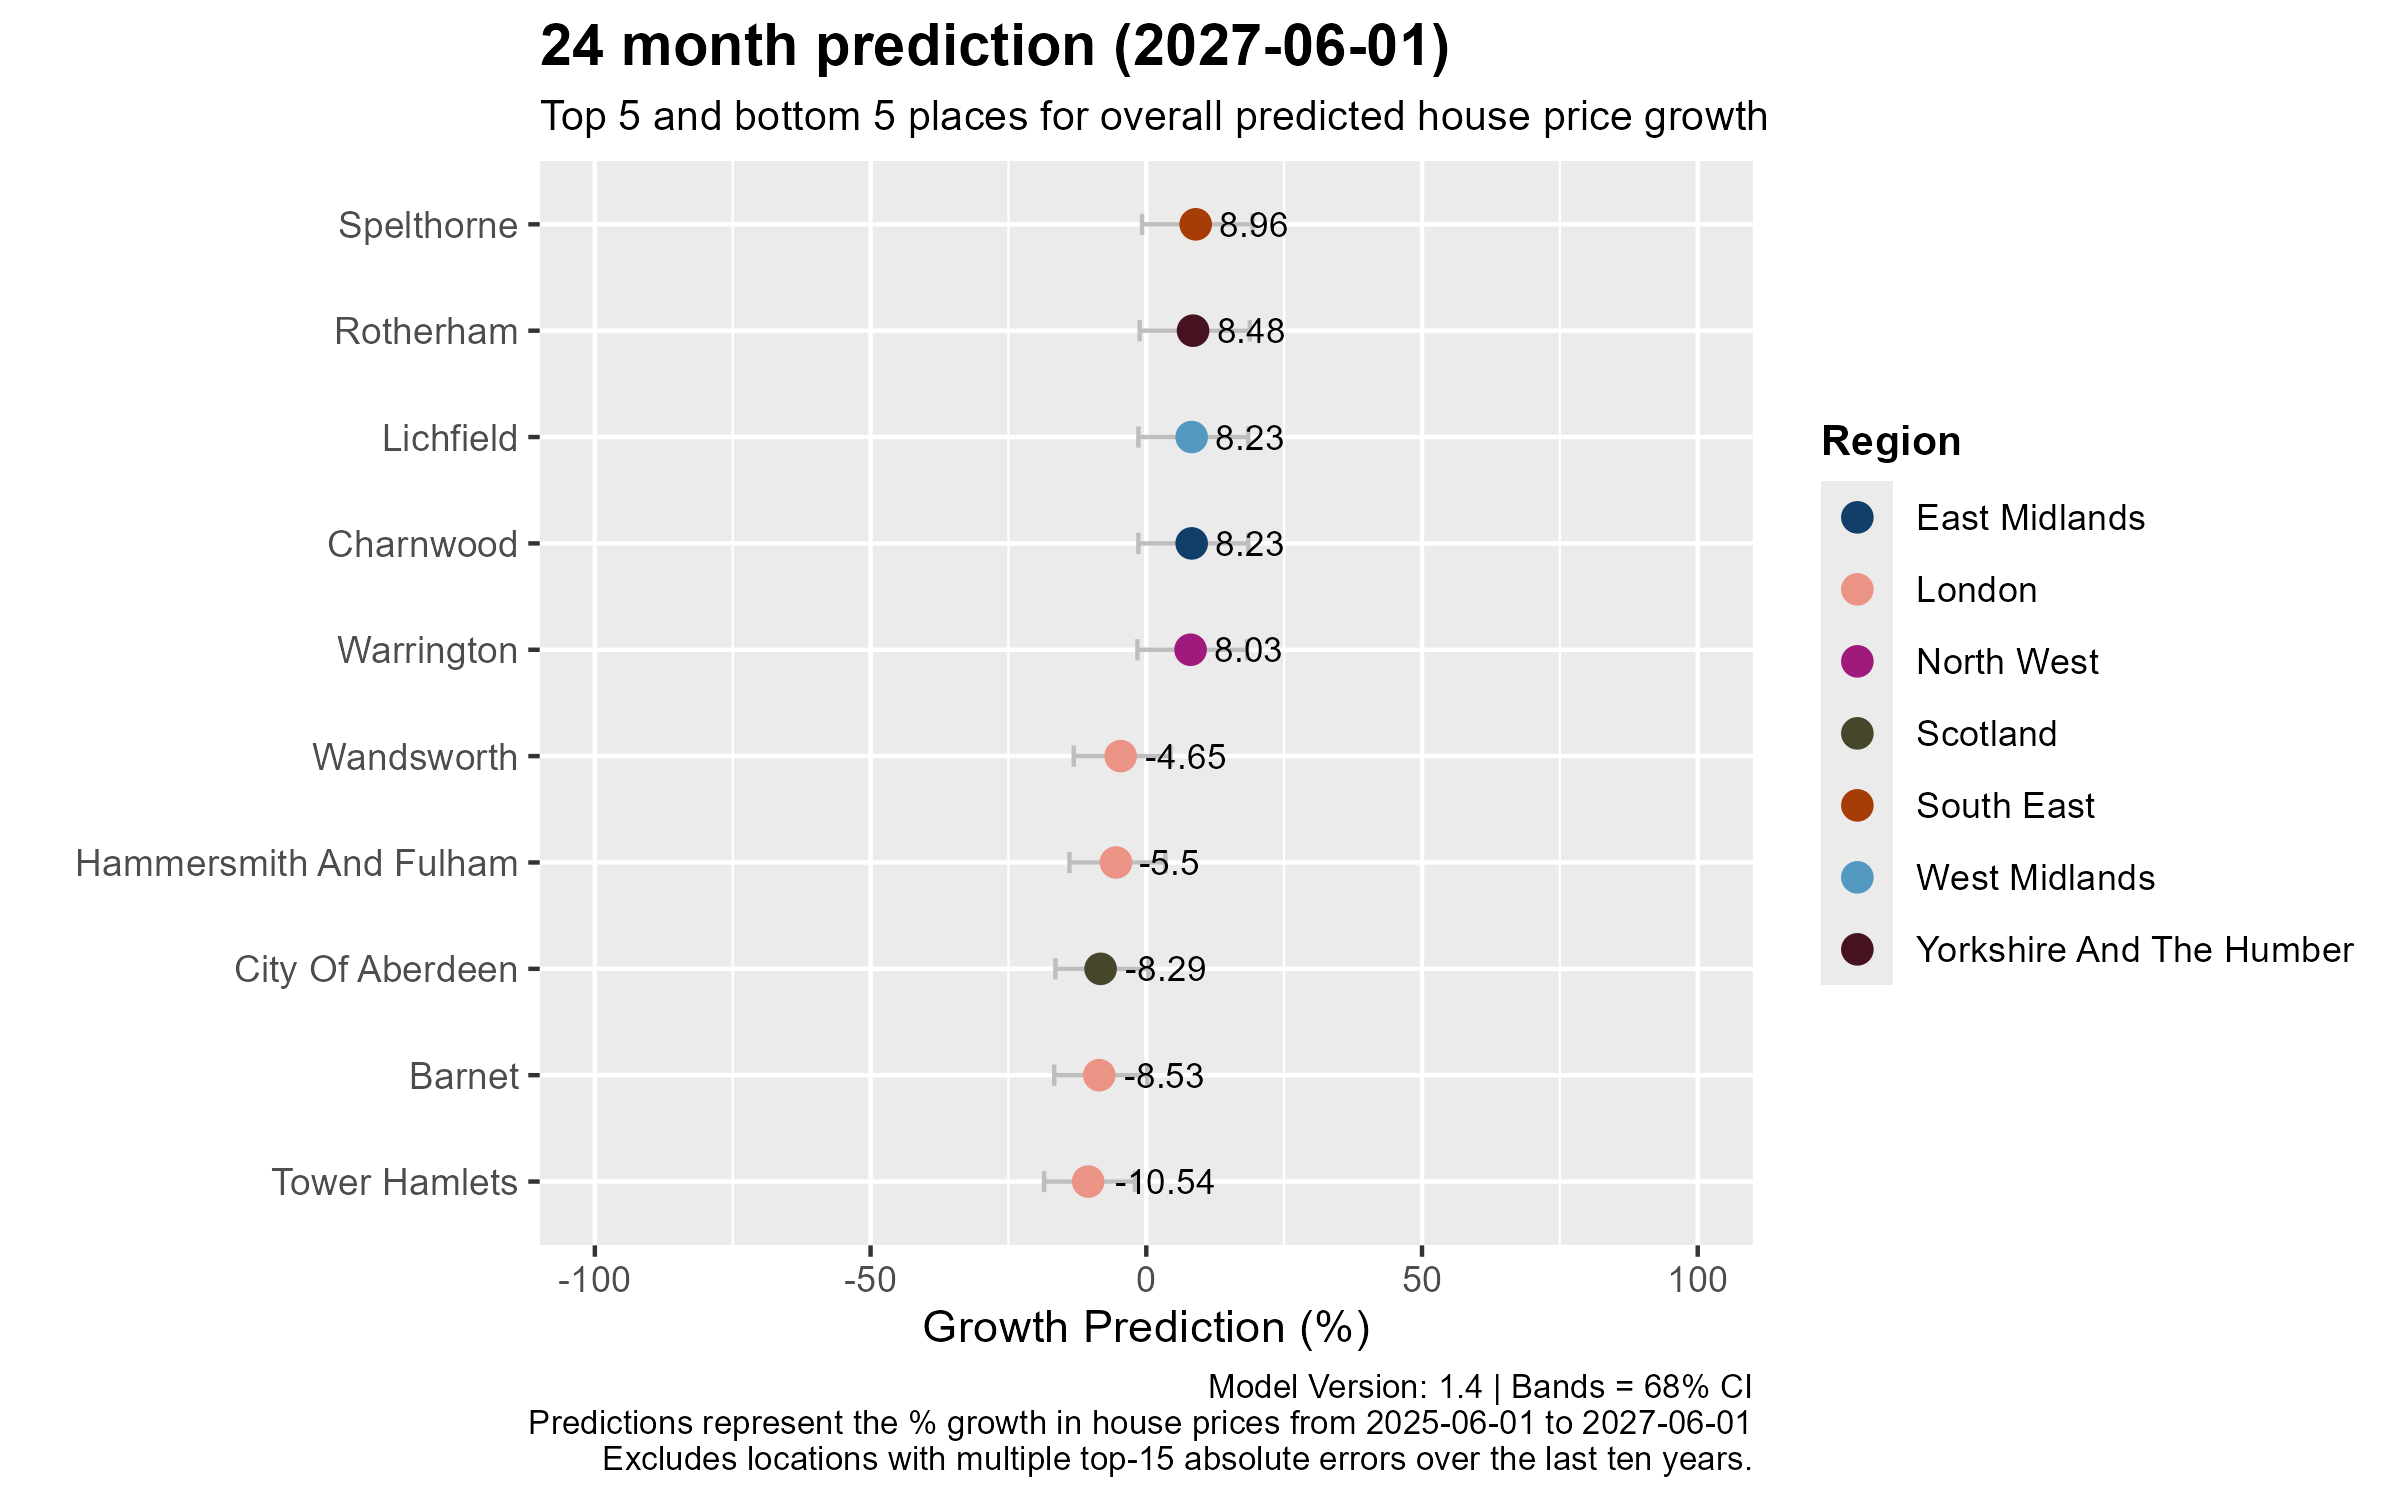
For the next 24 months, the leaders are Spelthorne (South East, c. 8.96 per cent), Rotherham (Yorkshire and The Humber, c. 8.48 per cent), Lichfield (West Midlands, c. 8.23 per cent), Charnwood (East Midlands, c. 8.23 per cent) and Warrington (North West, c. 8.03 per cent).
At the other end, the weakest are Tower Hamlets (London, c. –10.54 per cent), Barnet (London, c. –8.53 per cent), the City of Aberdeen (Scotland, c. –8.29 per cent), Hammersmith & Fulham (London, c. –5.50 per cent) and Wandsworth (London, c. –4.65 per cent).
This implies a dispersion of roughly 19.5 percentage points, with downside concentrated in high-cost London boroughs (plus Aberdeen) while solid mid-single-digit gains are expected across value-oriented Midlands and northern locations; the confidence bands are moderate, signalling some uncertainty around these central estimates.
For the next 60 months, the strongest cumulative gains are forecast in Armagh City, Banbridge and Craigavon (Northern Ireland, c. 23.8 per cent), Antrim and Newtownabbey (Northern Ireland, c. 22.5 per cent), Oldham (North West, c. 21.8 per cent), Rotherham (Yorkshire and The Humber, c. 21.5 per cent) and Knowsley (North West, c. 21.2 per cent).
The weakest long-run outlooks are Tower Hamlets (London, c. –19.9 per cent), the City of Aberdeen (Scotland, c. –19.9 per cent), Barnet (London, c. –10.6 per cent), Hertsmere (East of England, c. –4.1 per cent) and South Ayrshire (Scotland, c. –3.8 per cent).
This implies a very wide dispersion of about 43.7 percentage points, with long-term strength concentrated in Northern Ireland and value-oriented northern markets, while downside risks persist in several London boroughs and parts of Scotland; confidence bands are present but the pattern points to a continued tilt away from high-cost southern areas.

Conclusion
In summary, the forecasts point to an enduring north–south divide: the 12-month spread runs from (c. +4.4 per cent) to (c. –8.4 per cent), widens at 24 months to (c. +9.0 per cent) vs (c. –10.5 per cent), and by five years reaches (c. +23.8 per cent) vs (c. –19.9 per cent). Former lower-price areas—especially Northern Ireland and the North/ Midlands—are set to lead, while several London boroughs (and Aberdeen) underperform. This reflects persistent affordability pressures and shifting demand towards better-value markets, a pattern likely to define the UK housing landscape for years to come.

Leave a comment