
Economic summary
News
August was written by the bond market. Inflation rose to 2.9% in the 12 months to July, up from 2.6% in June, after Ofgem’s 13% price cap rise pushed gas bills up 14.7% — though core inflation held at 2.6% and services eased to 3.4%. The Bank of England had held Bank Rate at 3.75% on 30 July, but the 6–3 vote, with three members pressing for 4%, marked a shift. Activity held up: GDP grew 0.4% in the second quarter and unemployment eased to 4.9%. Then on 1 September 30-year gilt yields hit 5.89%, their highest since 1998, potentially halving the Chancellor’s headroom before the 28 October Budget.
Indicators
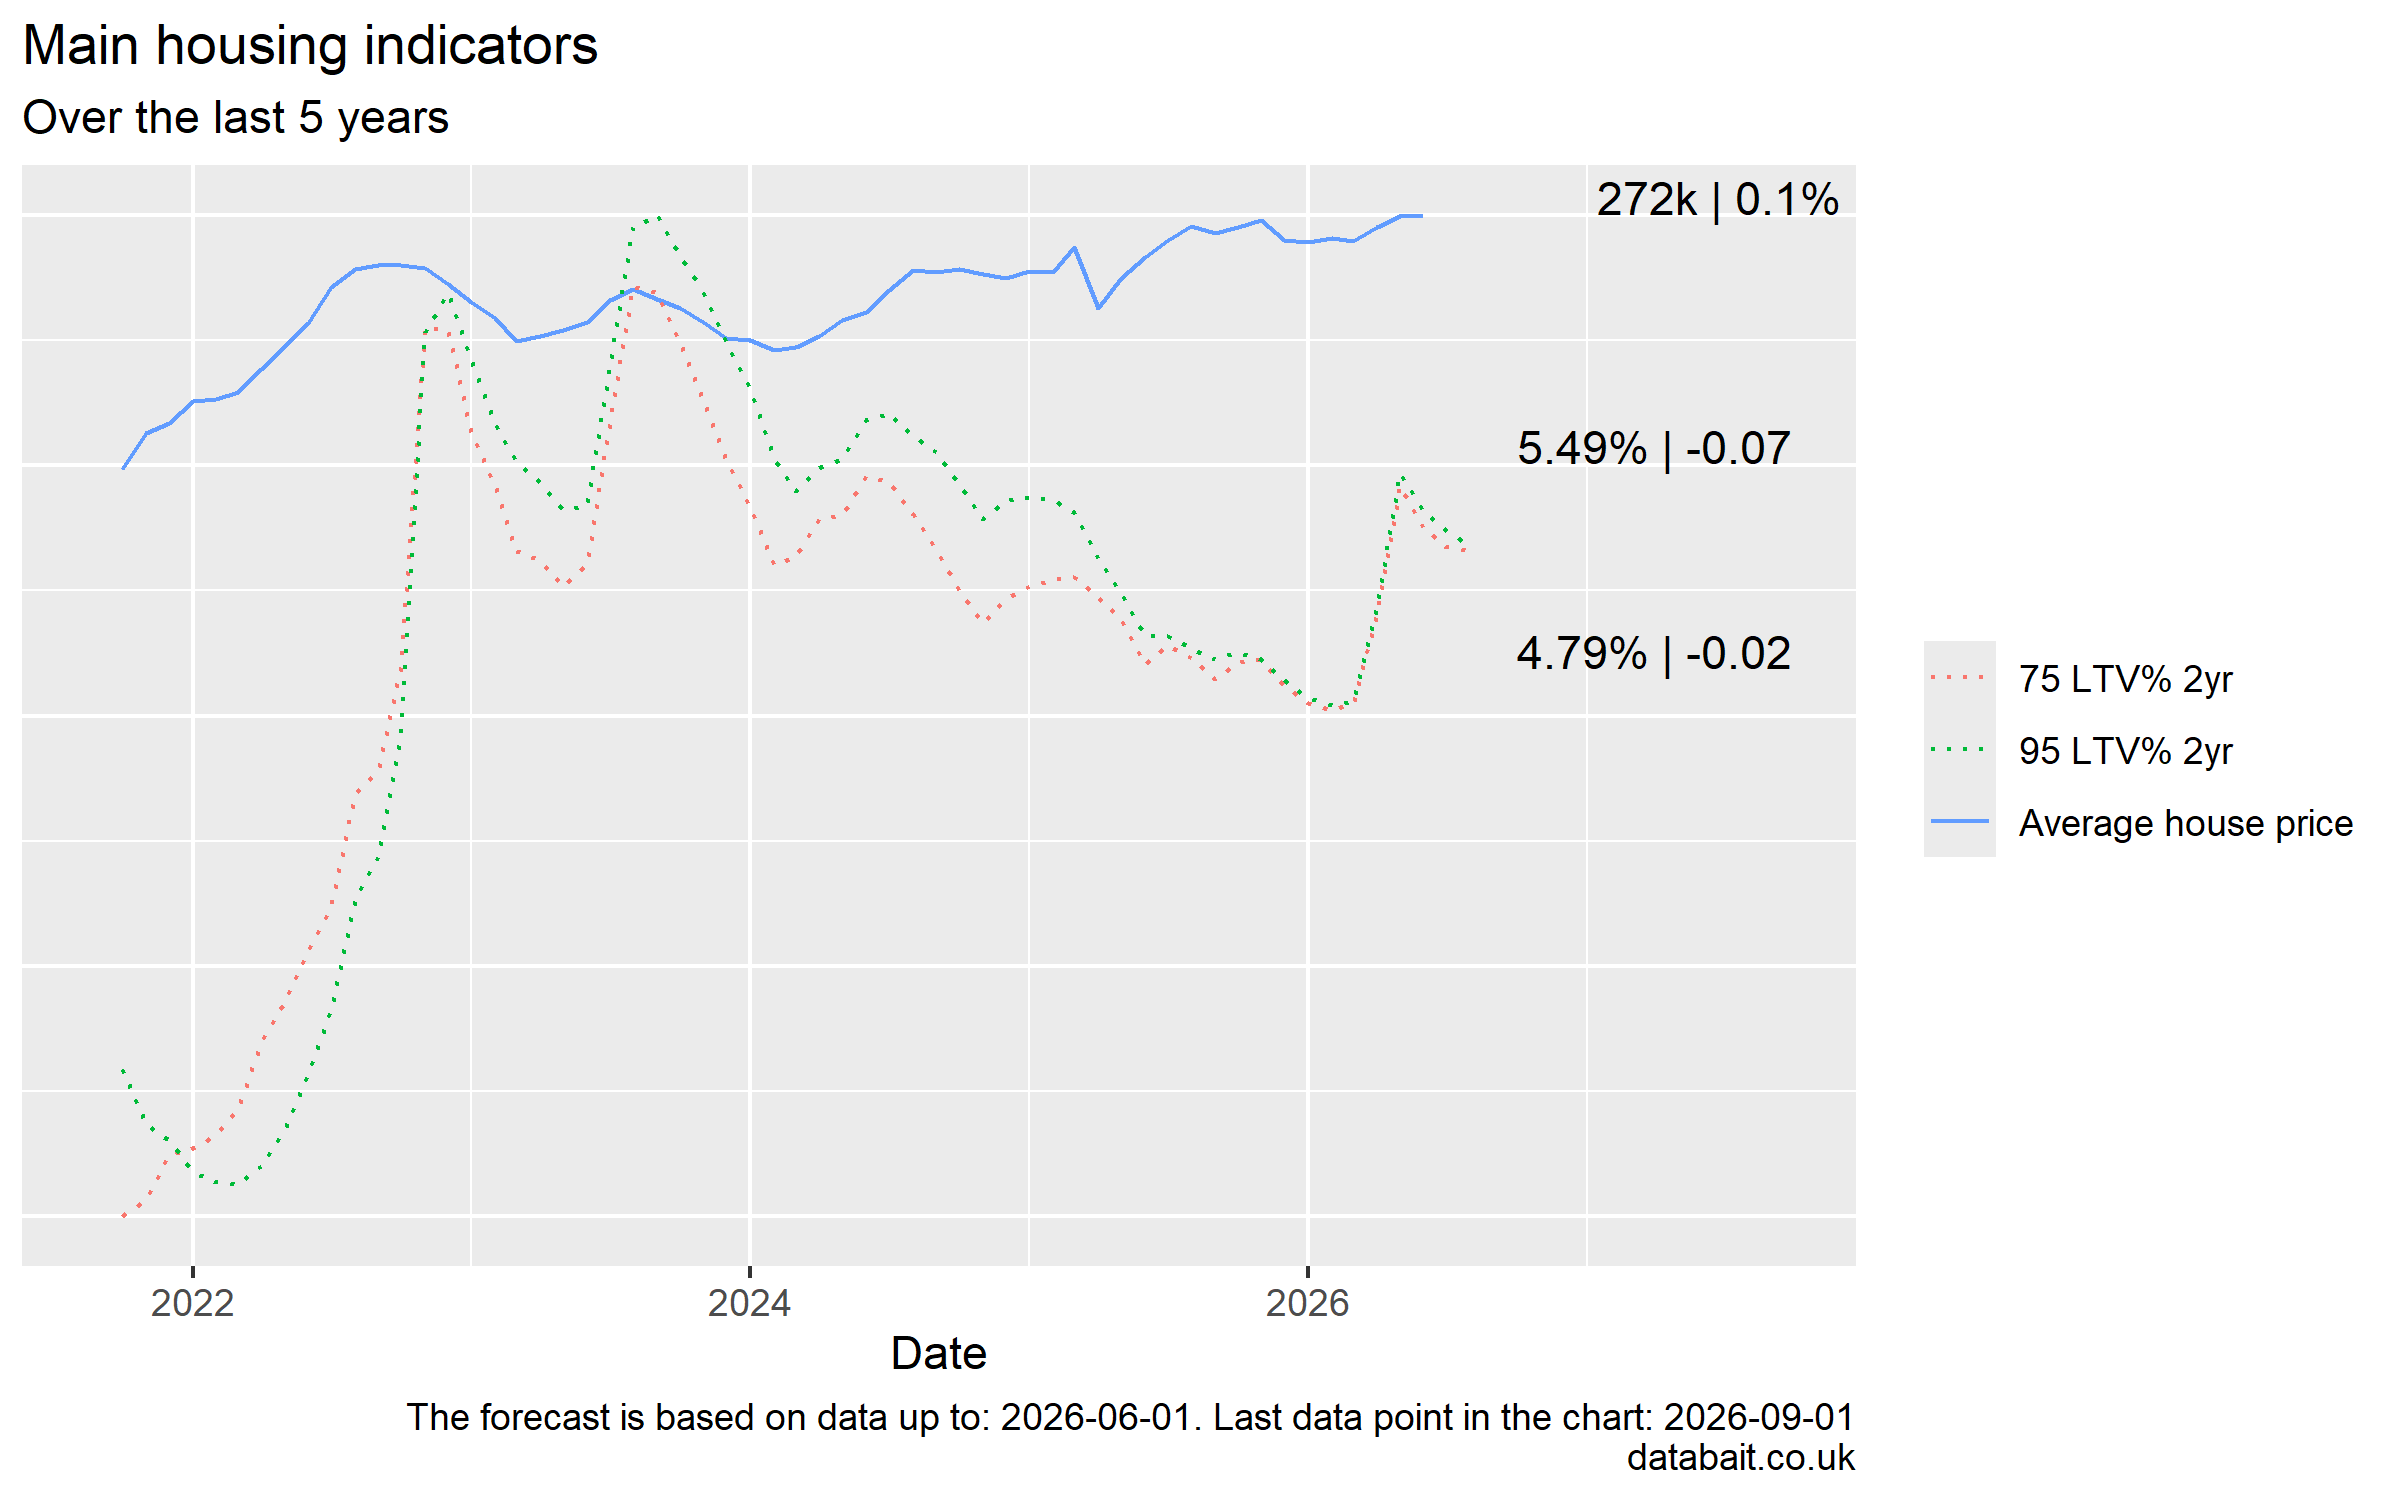
- Average house prices rose to £272k, up 0.1% on the previous month — matching the ONS, which put annual UK house price growth at 2.0% in the year to June, down from a revised 3.0% in May as the Stamp Duty base effect continued to unwind
- The average 75% LTV 2-year mortgage rate eased to 4.79% and the 95% LTV 2-year rate to 5.49%, down 2 and 7 basis points respectively — both now well below the spring peak, though the mortgage series runs to September while the price data stops at June
A note on the model
This month’s figures come from model version 2.1, up from 1.9 in July. The change is not cosmetic. Last month’s model had London topping the five-year rankings at +15% with Northern Ireland trailing at +6%; version 2.1 reverses that almost exactly. Regional and local forecasts below are therefore not directly comparable with previous posts, and the flip is large enough that it is worth treating this month as a fresh starting point rather than an update.
Current growth rates
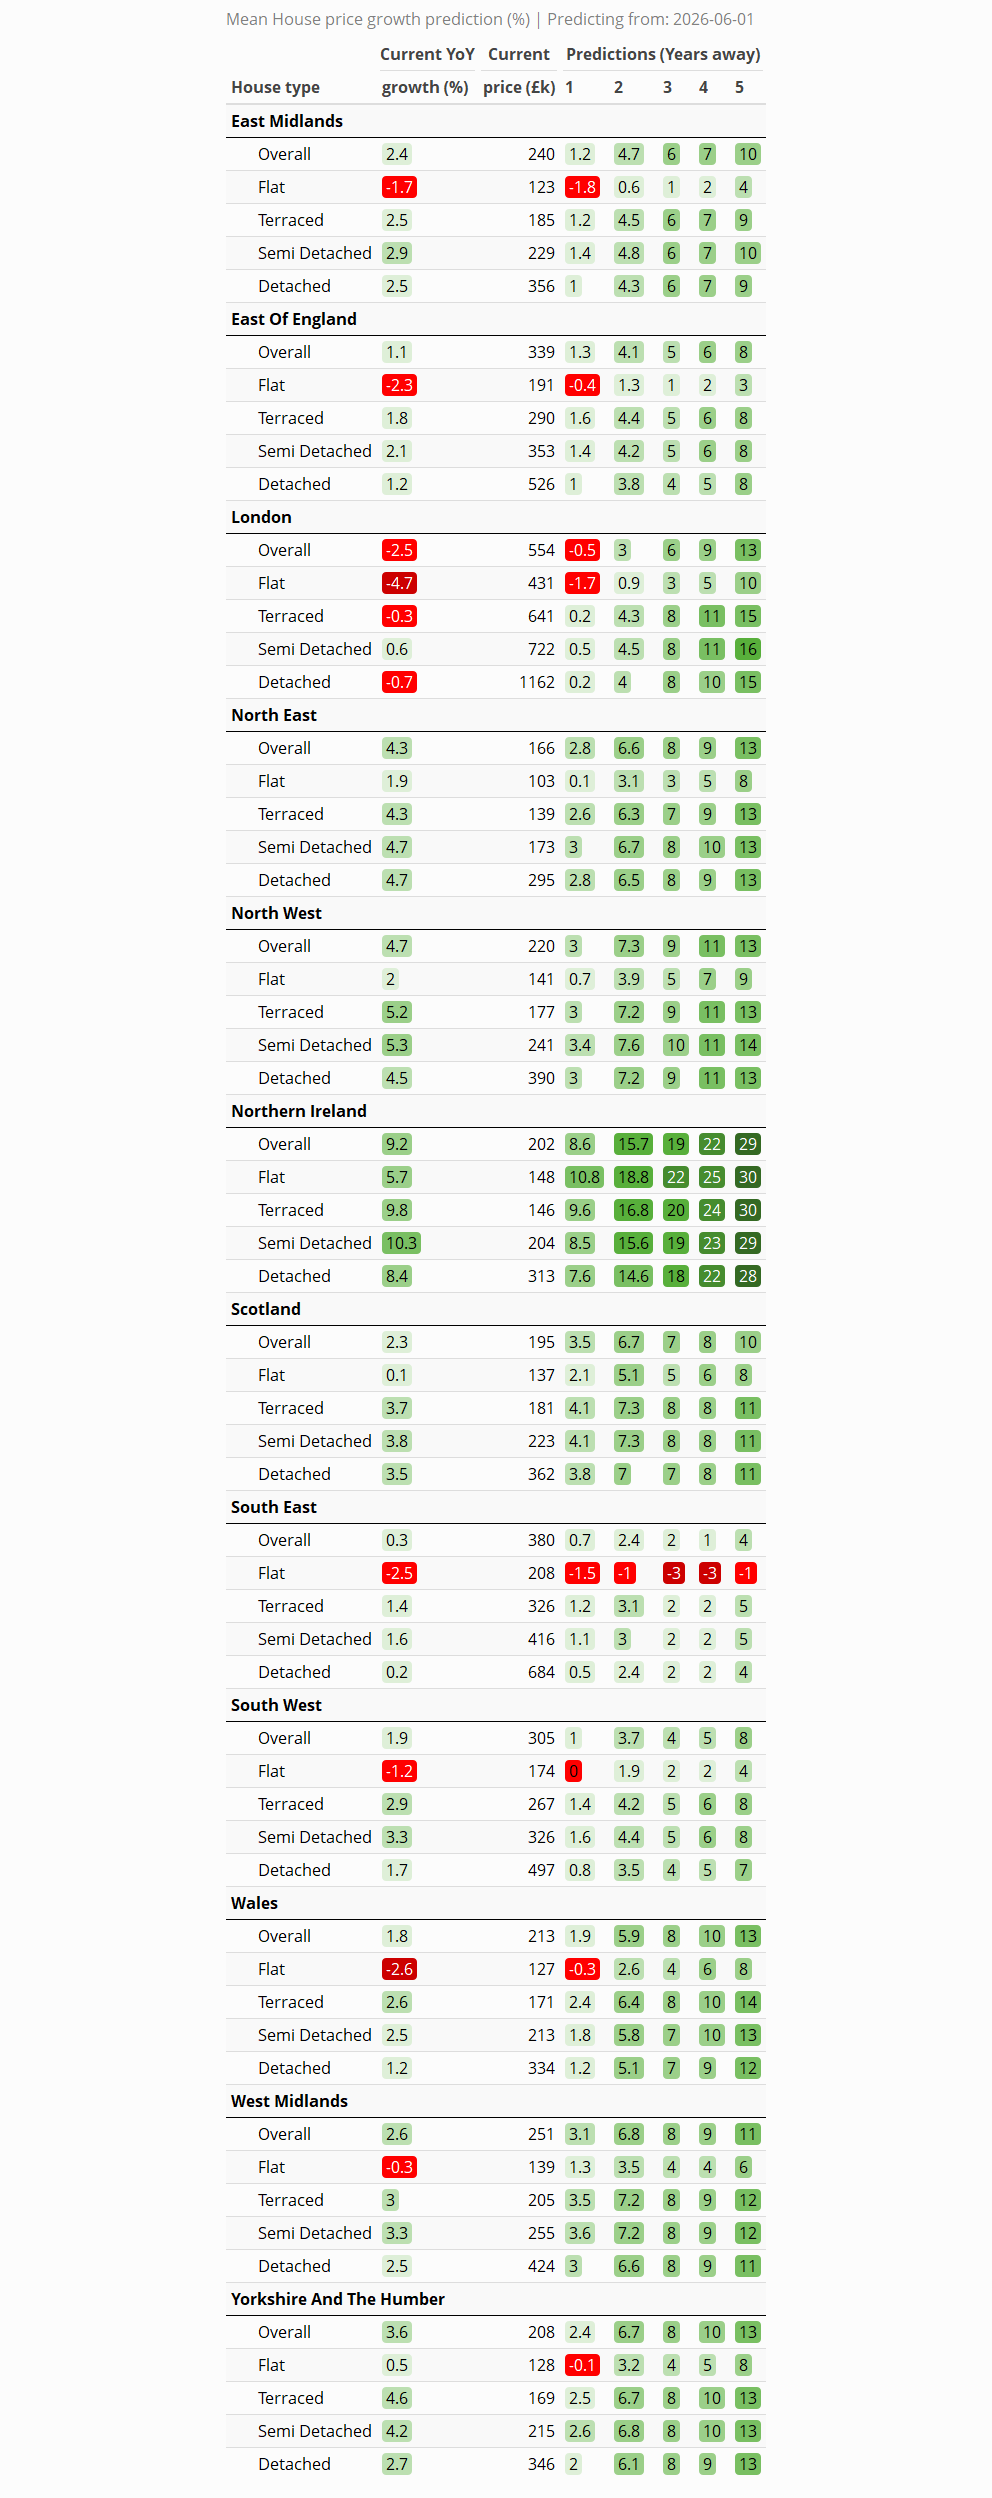
The north–south split has hardened into something close to a two-speed market. Northern Ireland is in a category of its own at +9.2% over the year, more than double the next fastest. The North West (+4.7%), North East (+4.3%) and Yorkshire and The Humber (+3.6%) form a clear second tier, followed by a middle group of the West Midlands (+2.6%), East Midlands (+2.4%) and Scotland (+2.3%). The South West (+1.9%) and Wales (+1.8%) sit just below, while the East of England (+1.1%) and South East (+0.3%) have all but stalled. London remains the only region in outright decline at −2.5%, its tenth consecutive month of annual falls.
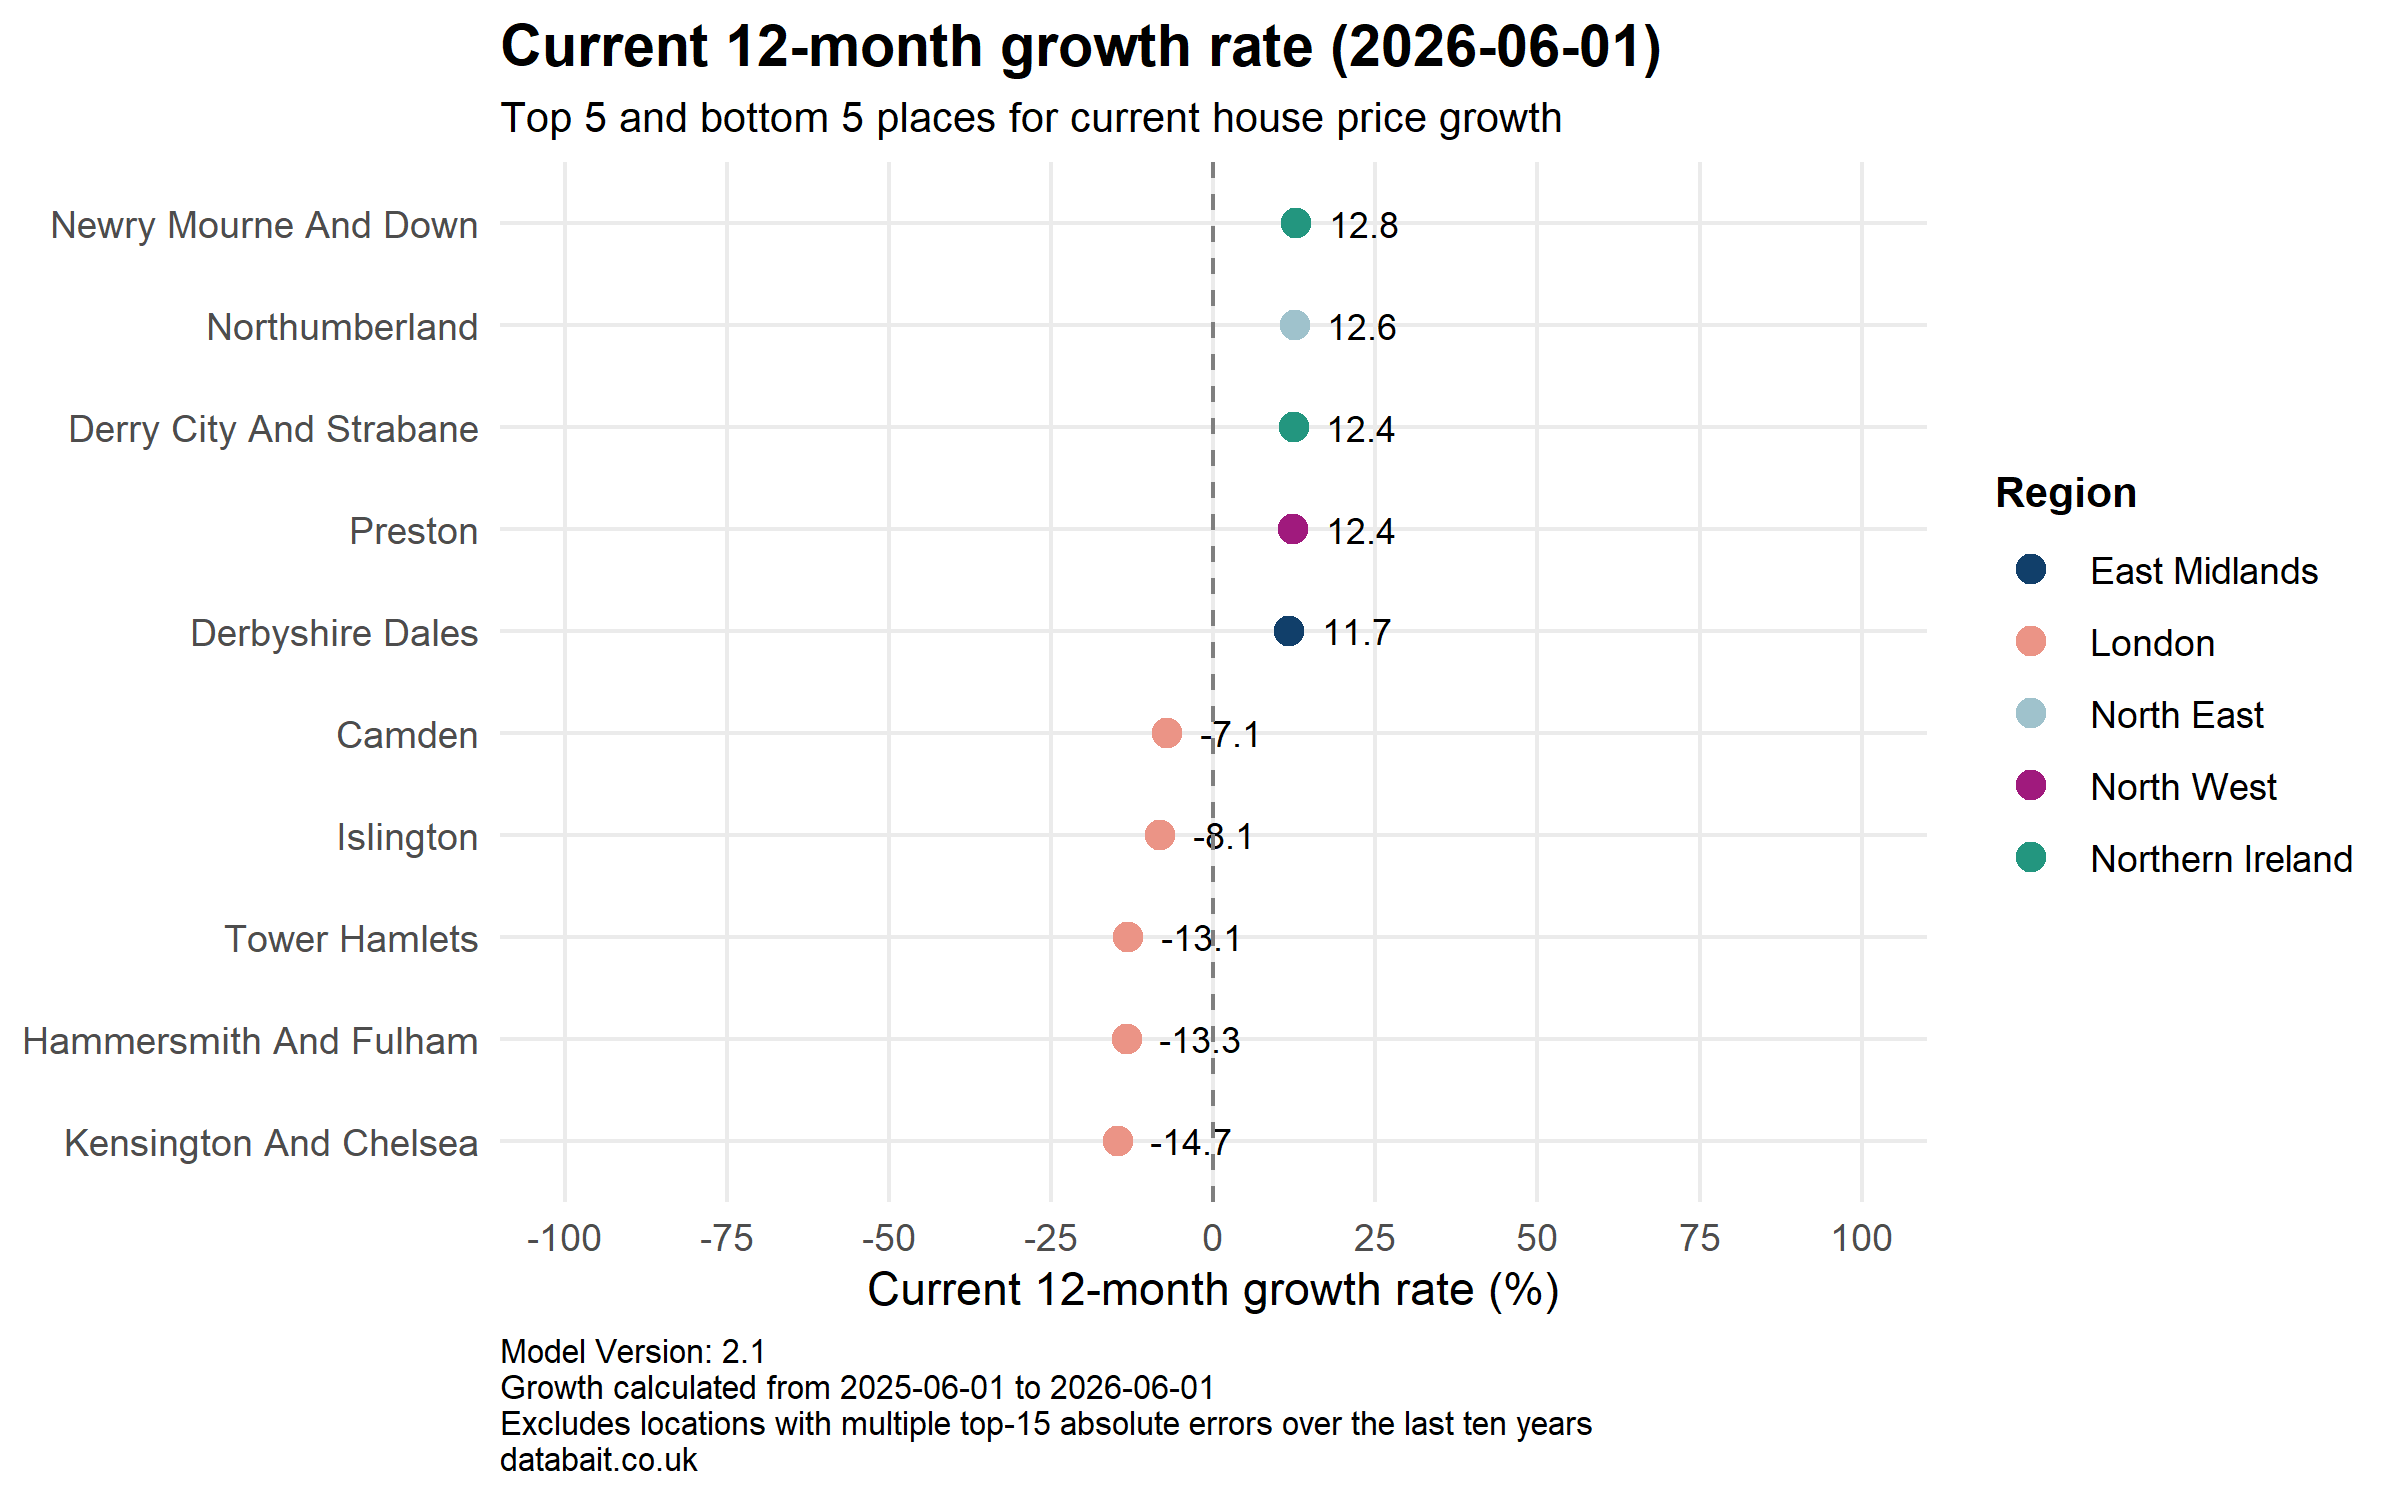
At local level the dispersion is wider still, and the composition has changed. Newry, Mourne and Down in Northern Ireland leads at +12.8%, followed by Northumberland in the North East (+12.6%), Derry City and Strabane (+12.4%), Preston in the North West (+12.4%) and Derbyshire Dales in the East Midlands (+11.7%). The bottom five is entirely London and entirely prime: Kensington and Chelsea has fallen 14.7% over the year, with Hammersmith and Fulham (−13.3%), Tower Hamlets (−13.1%), Islington (−8.1%) and Camden (−7.1%) close behind. That is a spread of 27.5 percentage points between best and worst, and the losses are now concentrated in the capital’s most expensive postcodes rather than its new-build belt.
Predictions
Overall
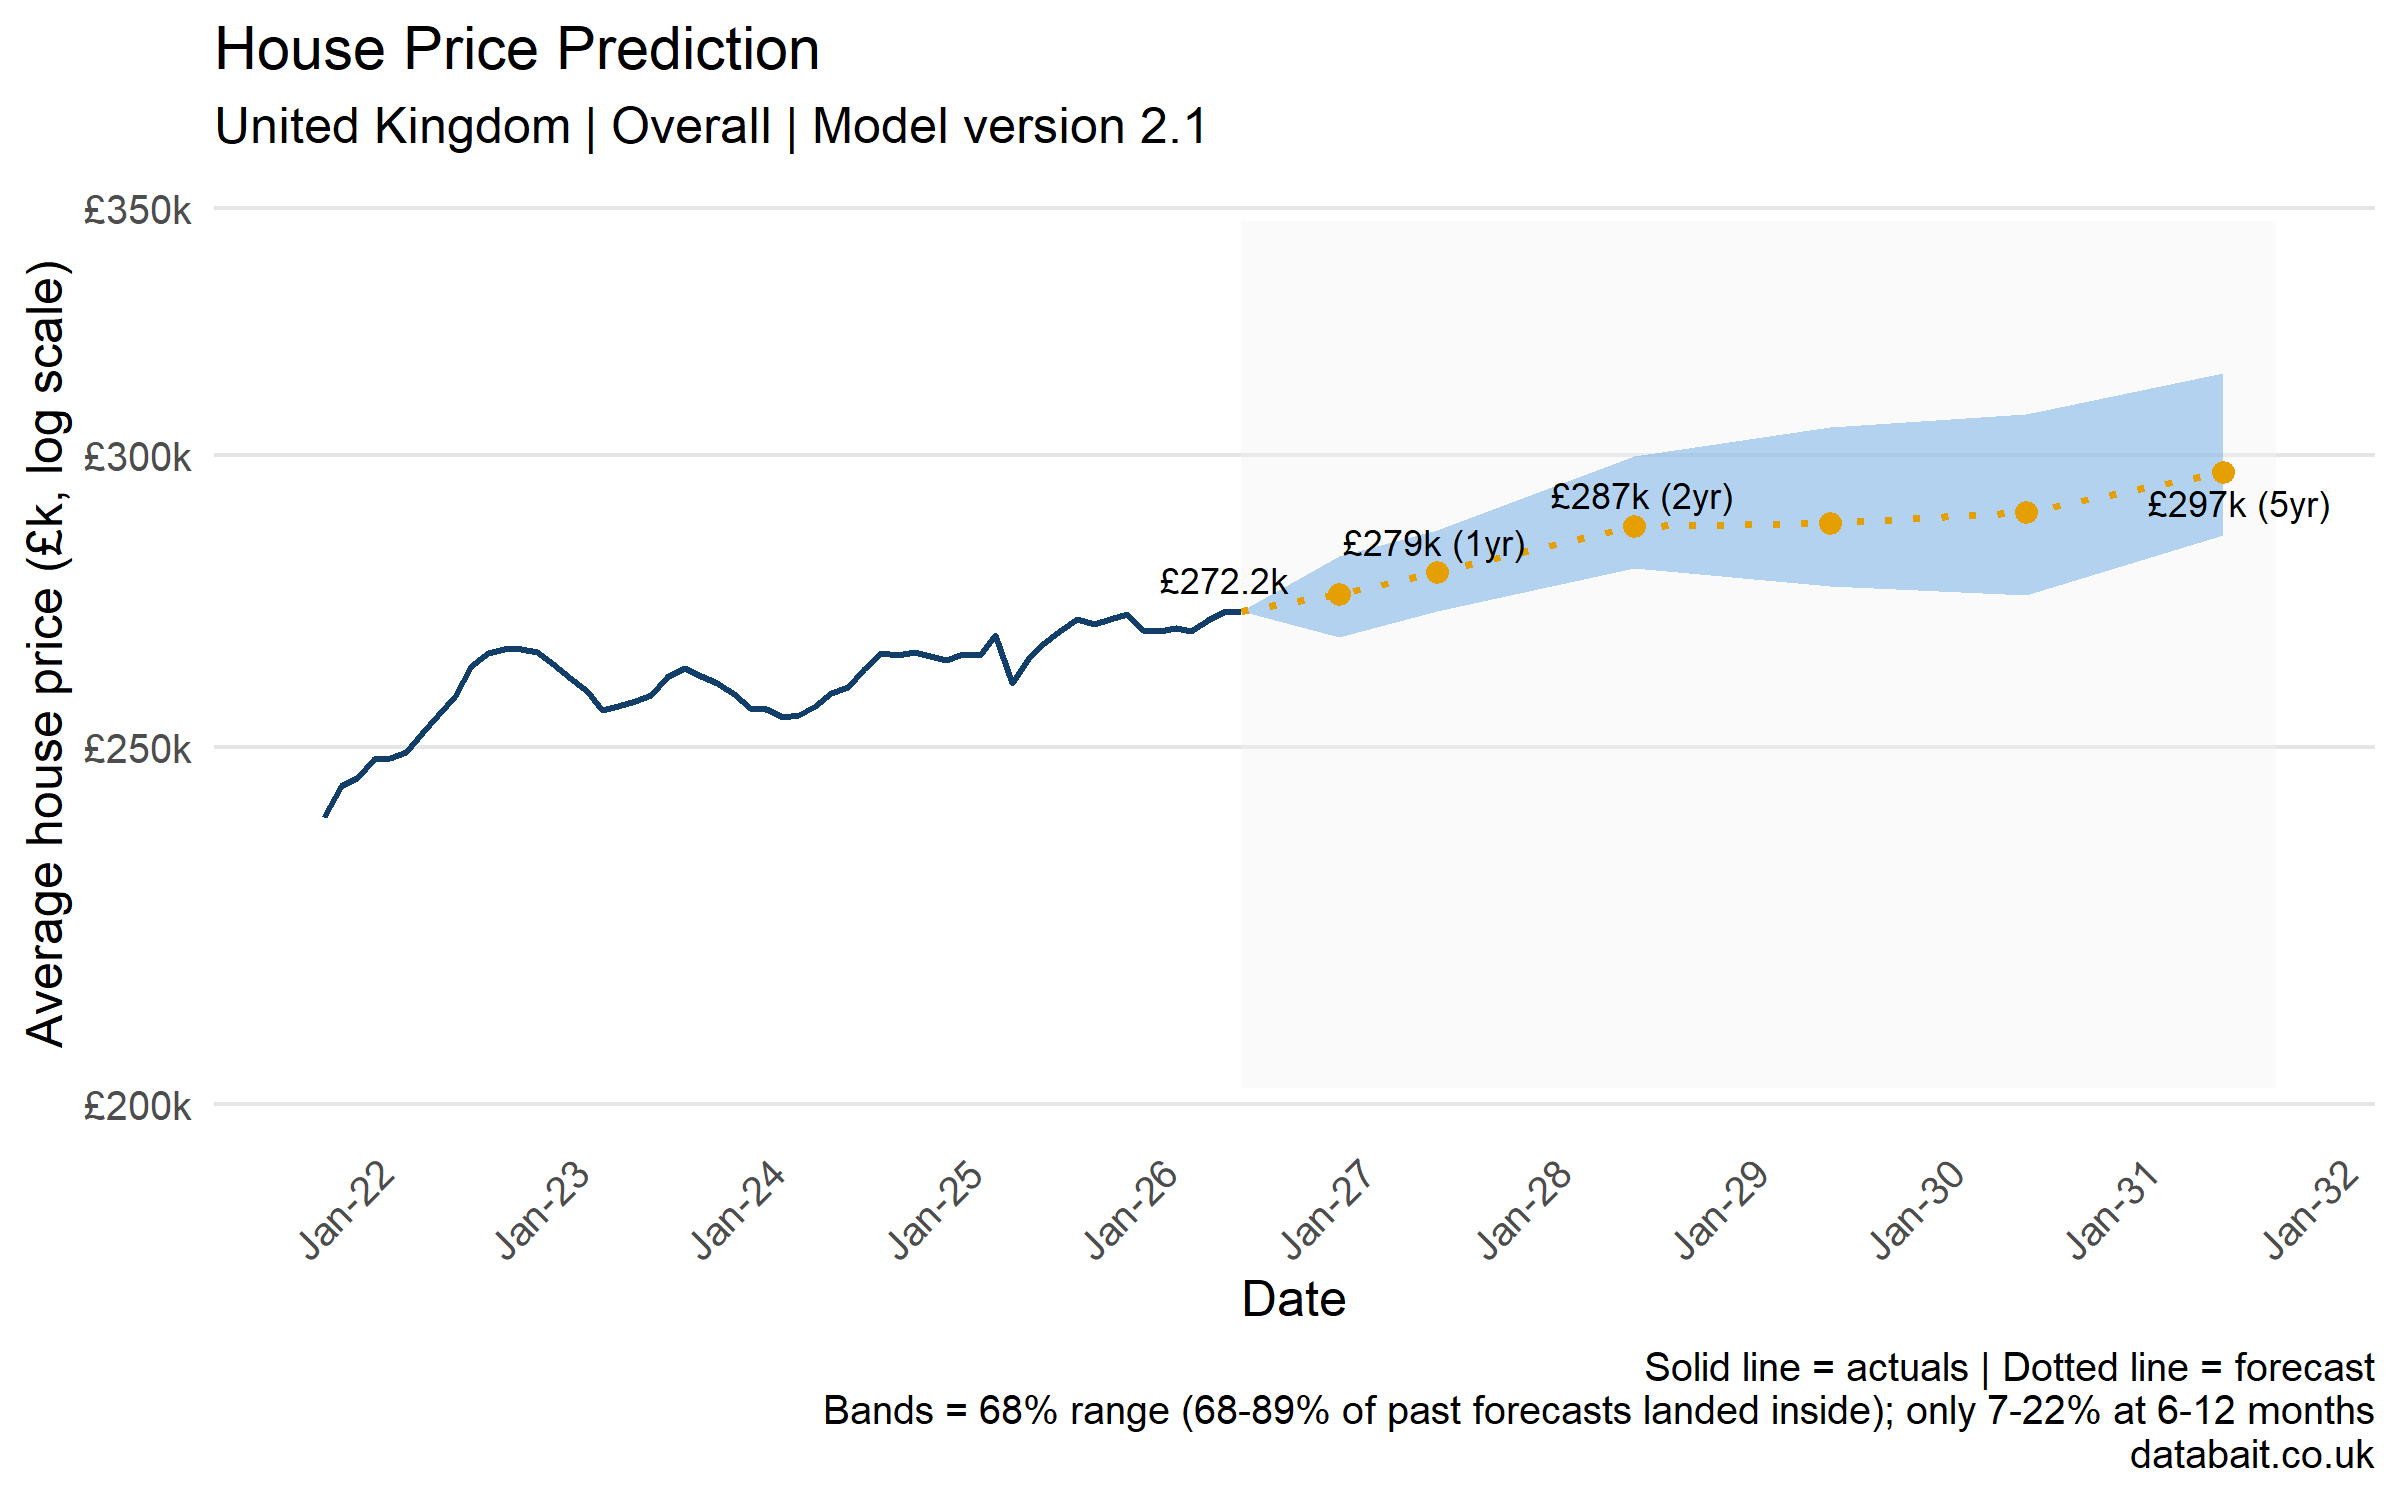
The model takes the current £272.2k to £279k within twelve months, £287k by 2028 and around £297k by 2031 — cumulative growth of roughly 9.1% over five years. The five-year endpoint is unchanged from last month, but the near-term path has been upgraded sharply, from +0.6% to +2.5% in year one.
Worth noting the chart’s own caveat: the 68% bands have historically contained 68–89% of past forecasts at longer horizons, but only 7–22% at six to twelve months. The near-term ranges are too narrow, and should be read as a central path rather than a confidence interval.
Regional
Short term (years 1–2): Northern Ireland dominates year one at +8.6%, three times the next fastest, with Scotland (+3.5%), the West Midlands (+3.1%) and the North West (+3.0%) leading the chasing pack and London the only region forecast to fall, at −0.5%. By year two Northern Ireland has compounded to +15.7% while the North West (+7.3%), West Midlands (+6.8%), Scotland (+6.7%), Yorkshire and The Humber (+6.7%) and North East (+6.6%) cluster together, leaving the South East (+2.4%) and London (+3.0%) at the back.
Medium term (years 3–4): The gap keeps widening rather than closing — Northern Ireland reaches +19% by year three and +22% by year four, with no other region above +11%. The North West (+9% then +11%) leads the rest, with Wales, Yorkshire and The Humber, the North East and West Midlands all clustered at +8% rising to +9–10%, and London recovering to +9% by year four. The South East is the notable casualty: it peaks at +2% in year three and slips back to +1% in year four, the only region to go backwards over the period.
Long term (year 5): Northern Ireland finishes at +29%, more than double any other region. London, the North West, the North East, Wales and Yorkshire and The Humber all land at +13%, with the West Midlands at +11% and Scotland and the East Midlands at +10%. The East of England and South West manage +8%, while the South East brings up the rear at +4% — a striking reversal of the July model, which had exactly these southern regions leading.
Flats remain the weak spot, but the geography of that weakness has shifted. South East flats are forecast to fall in every single year of the horizon (−1.5%, −1%, −3%, −3%, −1%), and flats are the worst-performing type in the East of England, South West and Wales. Northern Ireland is the exception in both directions: its flats start slowest on current growth (+5.7% against +10.3% for semis) yet lead the model at +30% over five years.
Local
12-month prediction (to June 2027)
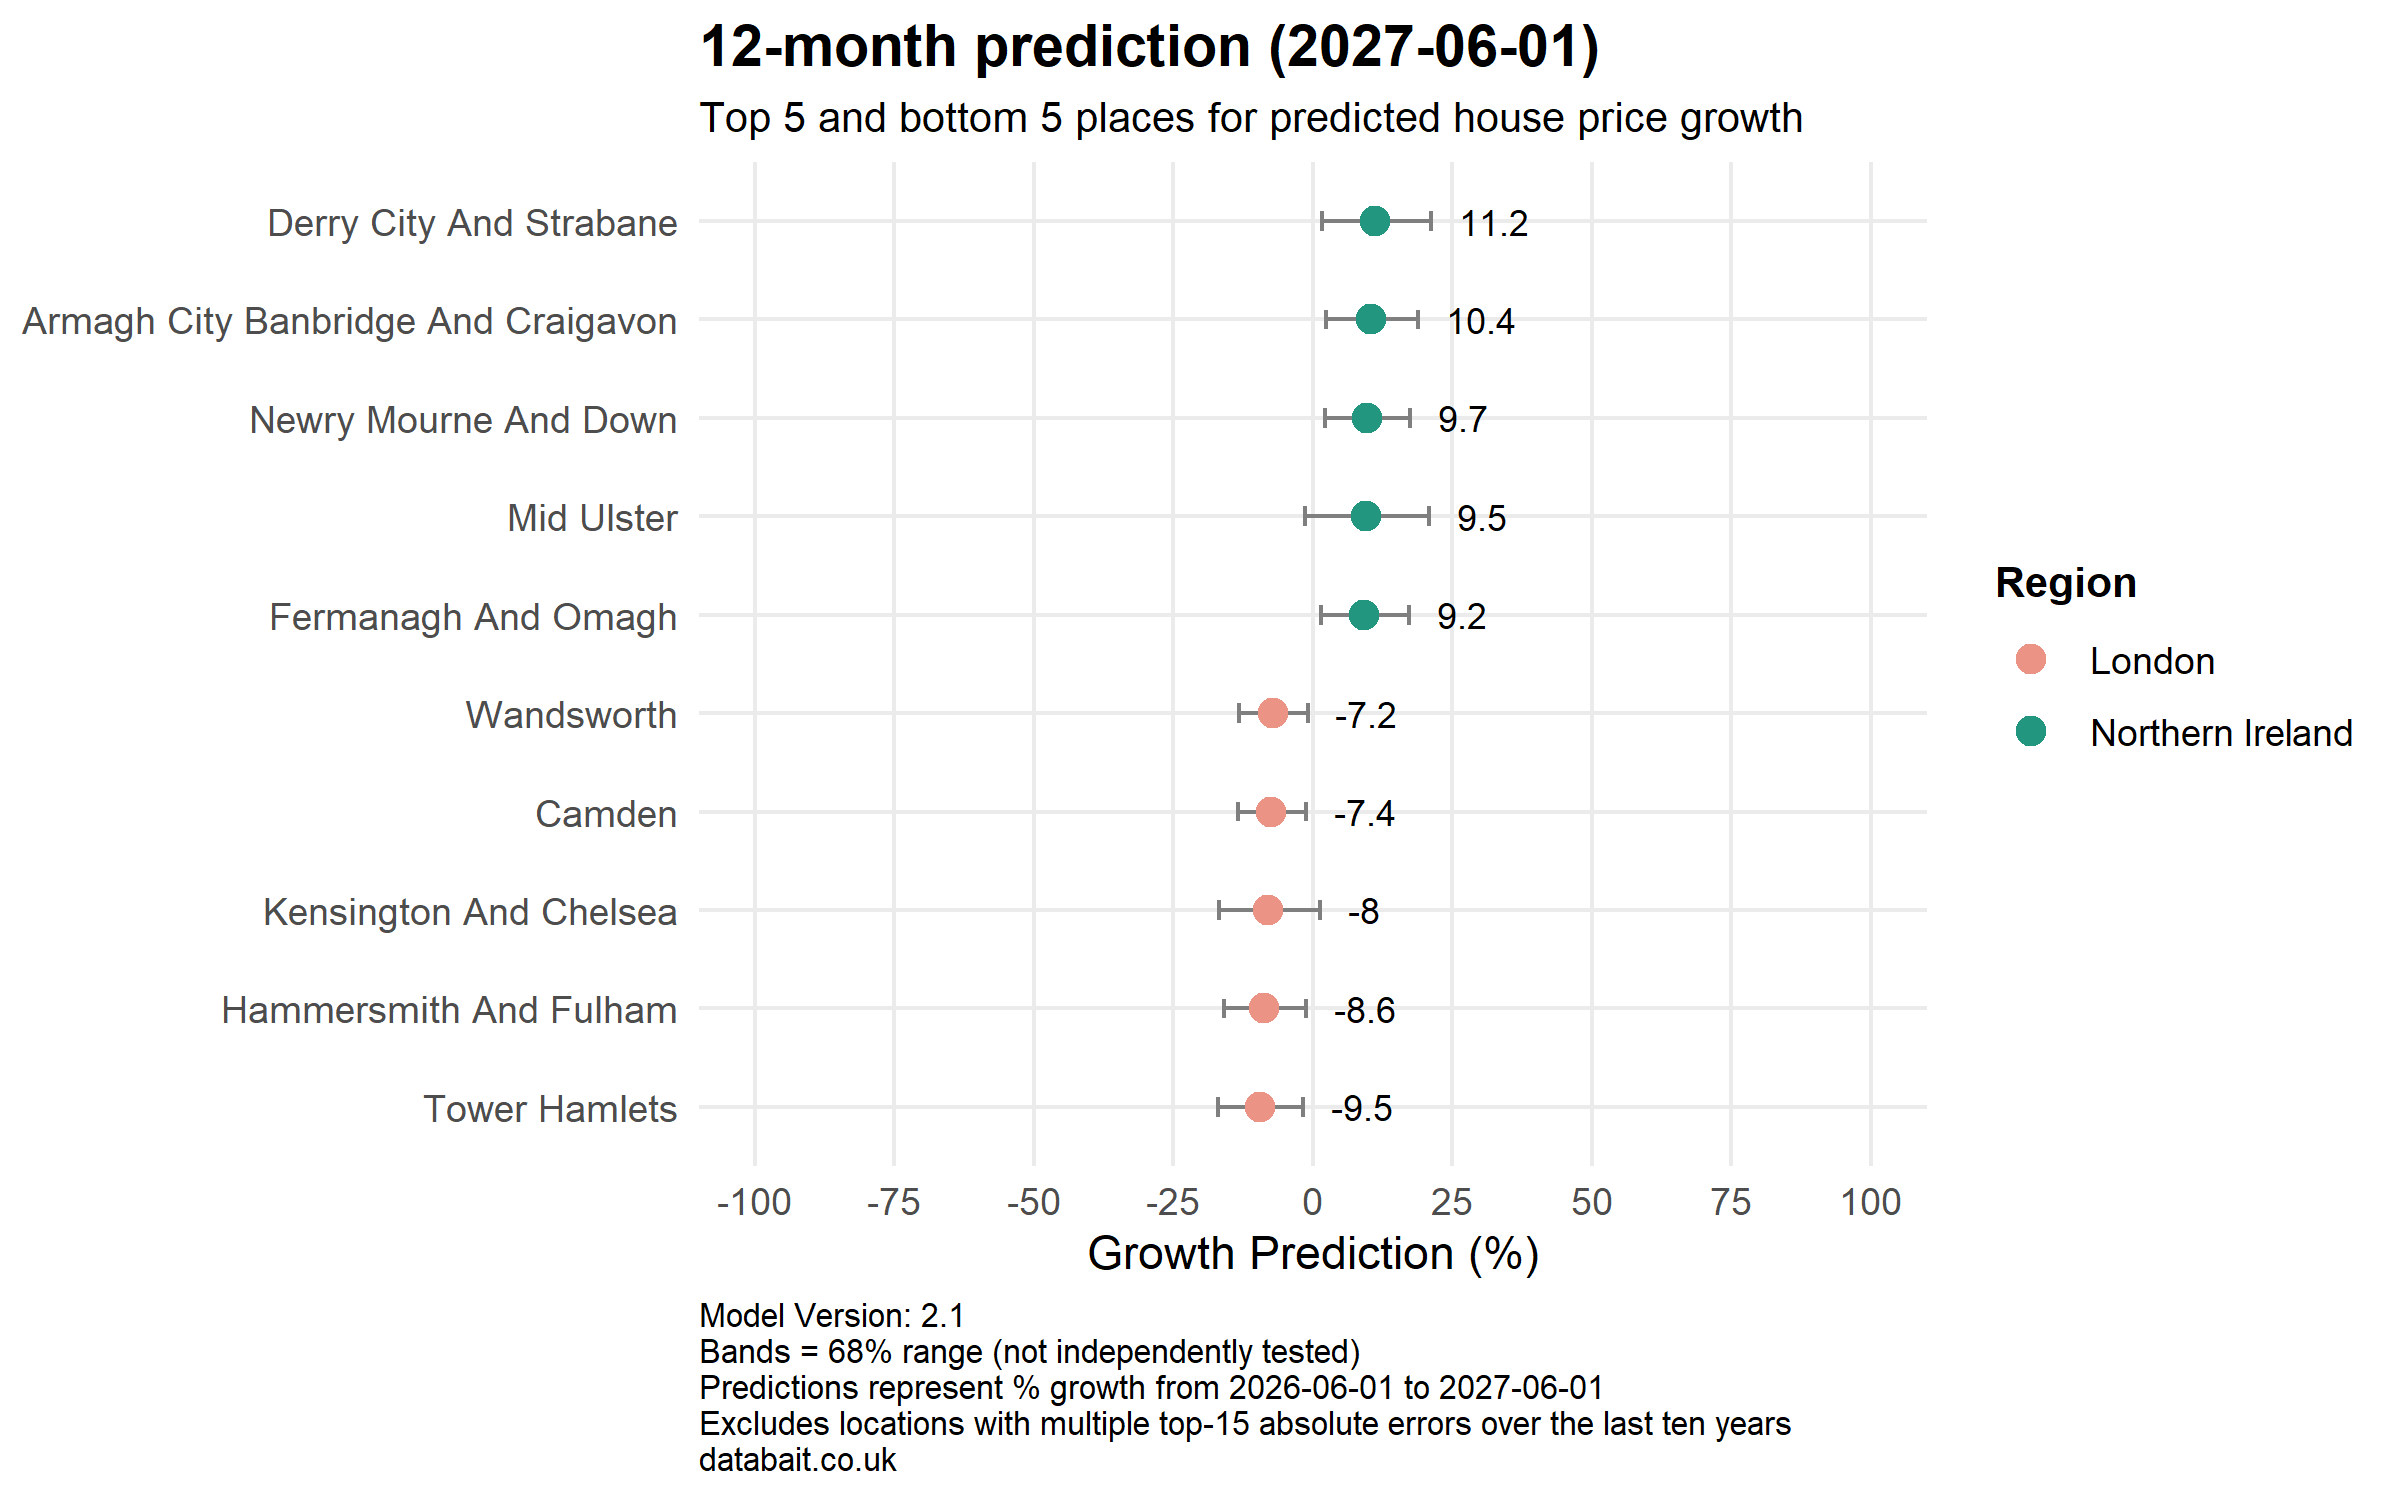
The near-term leaderboard is a clean sweep for Northern Ireland: Derry City and Strabane leads at +11.2%, followed by Armagh City, Banbridge and Craigavon (+10.4%), Newry, Mourne and Down (+9.7%), Mid Ulster (+9.5%) and Fermanagh and Omagh (+9.2%). The bottom five is an equally clean sweep for London, with Tower Hamlets weakest at −9.5%, then Hammersmith and Fulham (−8.6%), Kensington and Chelsea (−8.0%), Camden (−7.4%) and Wandsworth (−7.2%). The model is not forecasting a broad London recovery in year one — it expects the capital’s correction to run for at least another twelve months, concentrated in the same expensive boroughs already falling fastest.
24-month prediction (to June 2028)
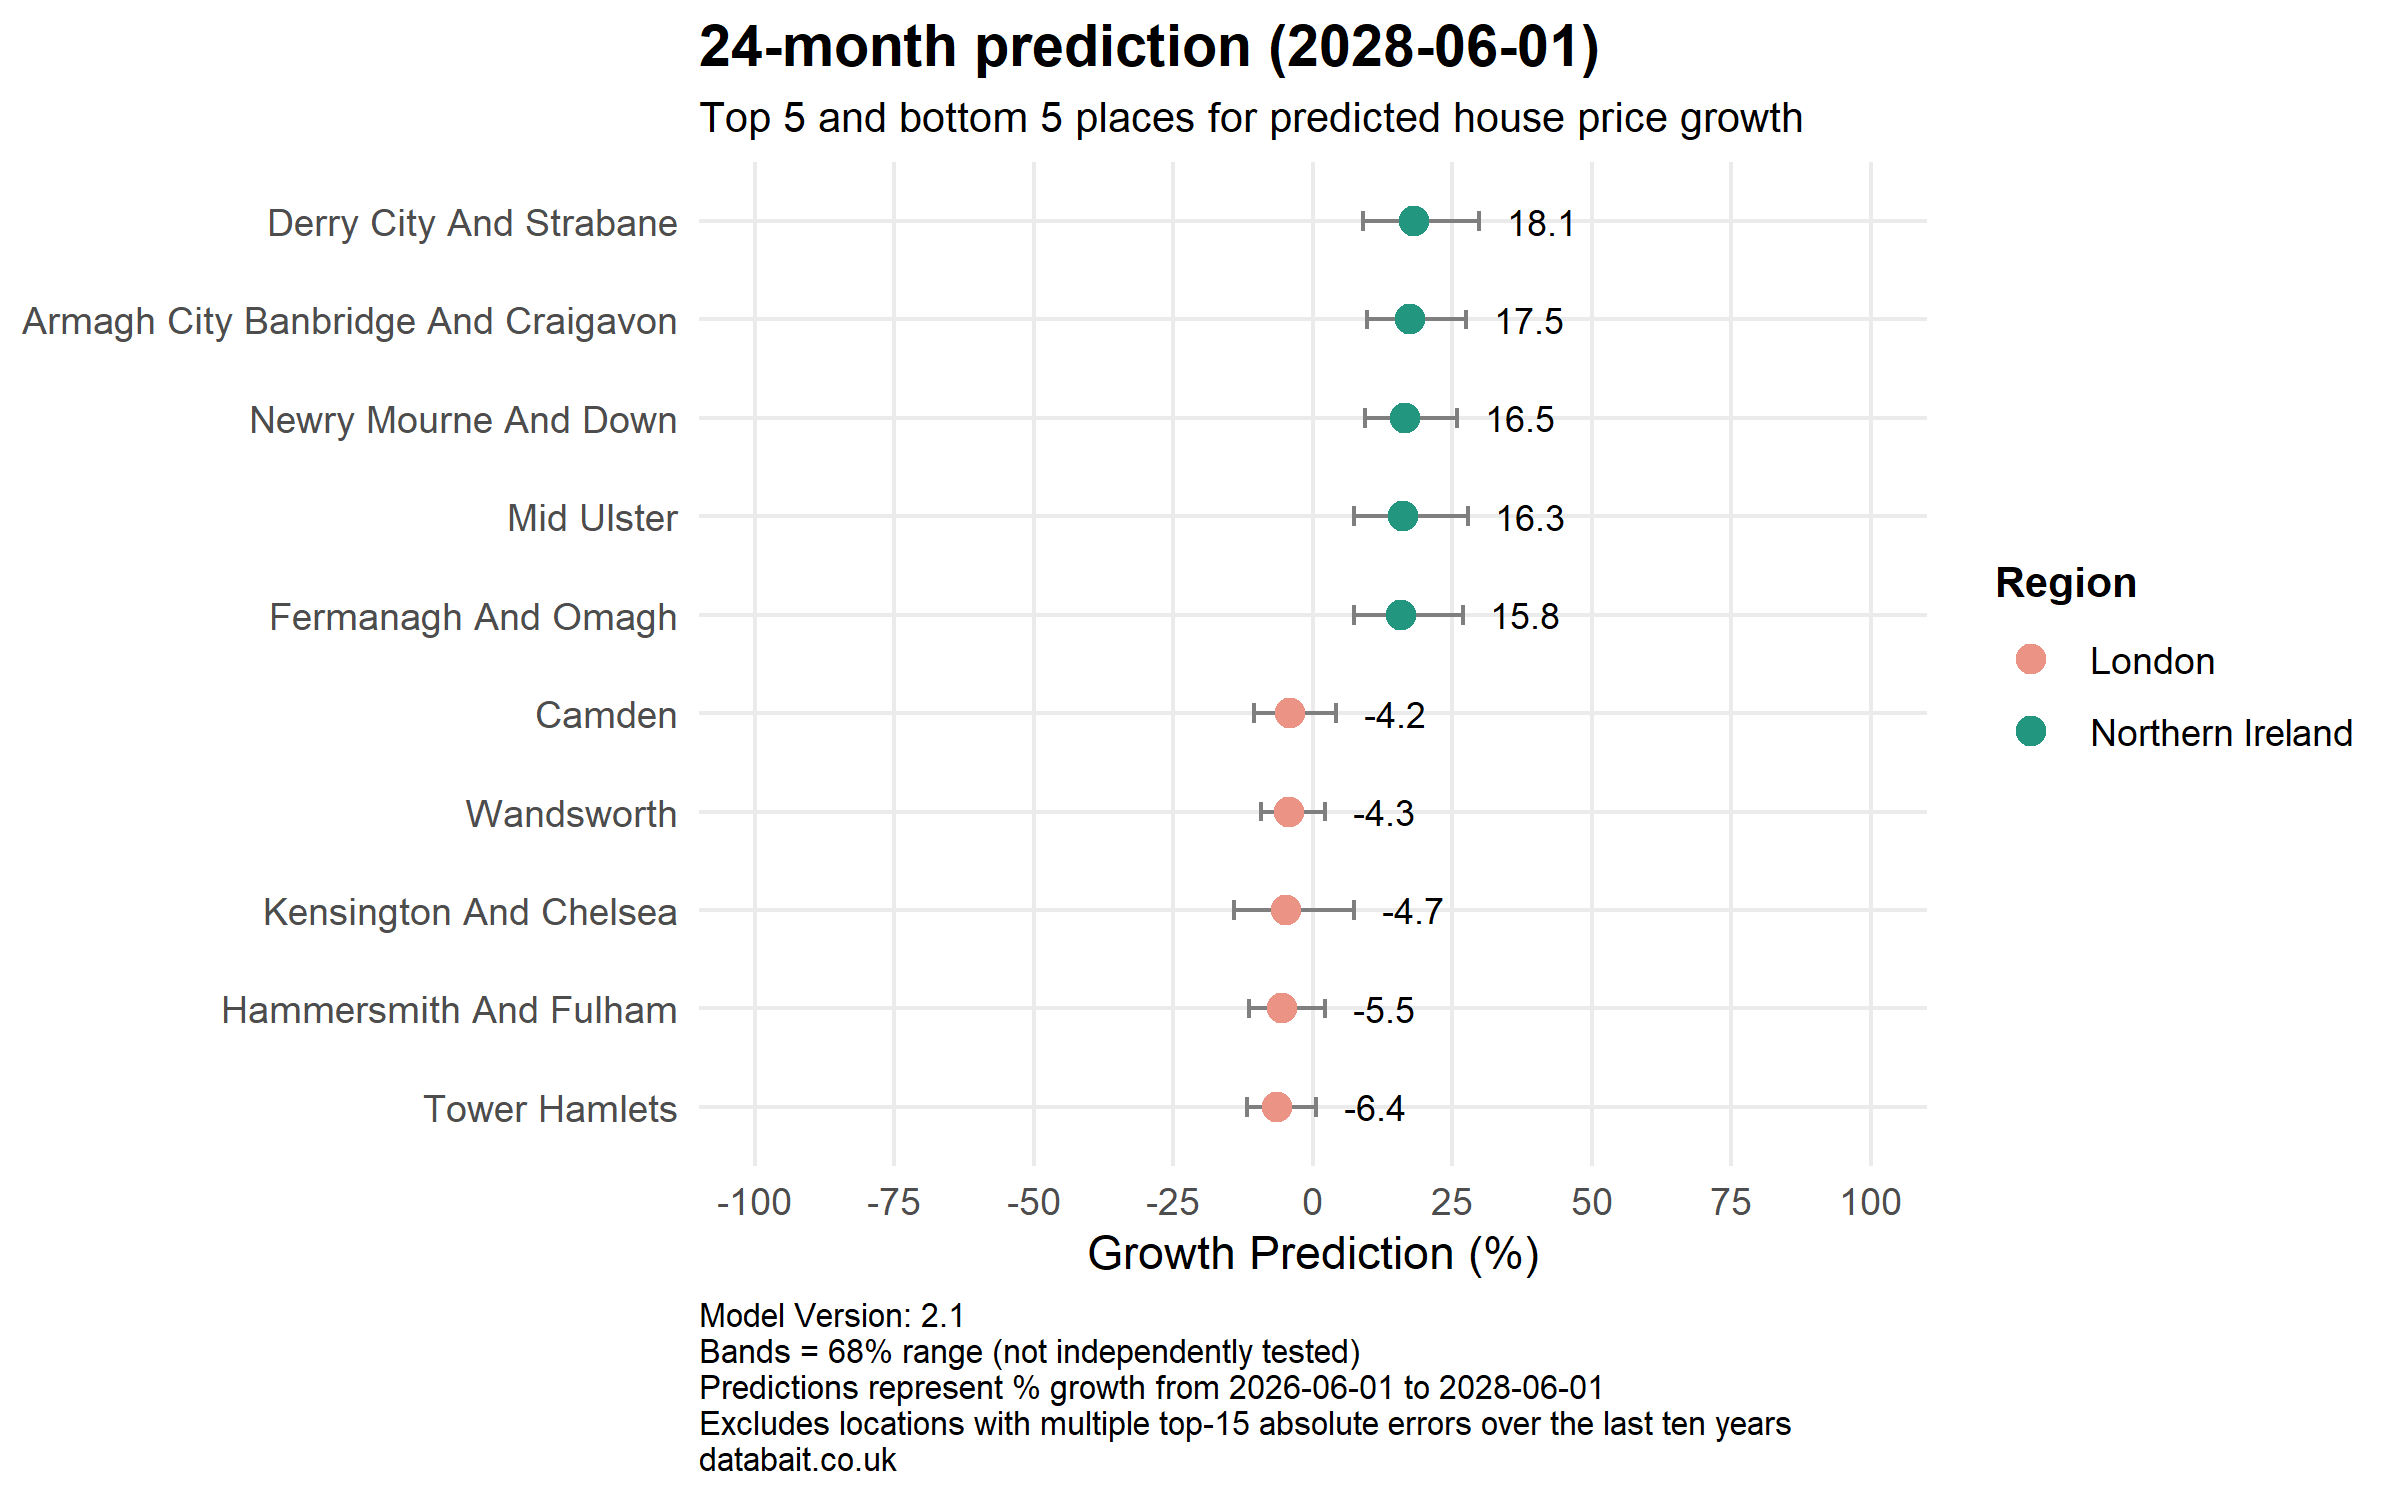
At two years the same five Northern Irish councils hold the top spots, with Derry City and Strabane at +18.1%, Armagh City, Banbridge and Craigavon at +17.5% and Newry, Mourne and Down, Mid Ulster and Fermanagh and Omagh between +15.8% and +16.5%. The London laggards are moderating rather than deepening: Tower Hamlets improves from −9.5% to −6.4% cumulative, with Hammersmith and Fulham (−5.5%), Kensington and Chelsea (−4.7%), Wandsworth (−4.3%) and Camden (−4.2%) all shallower than at twelve months. In other words, the model has prime London roughly finding a floor in year two, but not yet recovering the ground lost.
60-month prediction (to June 2031)
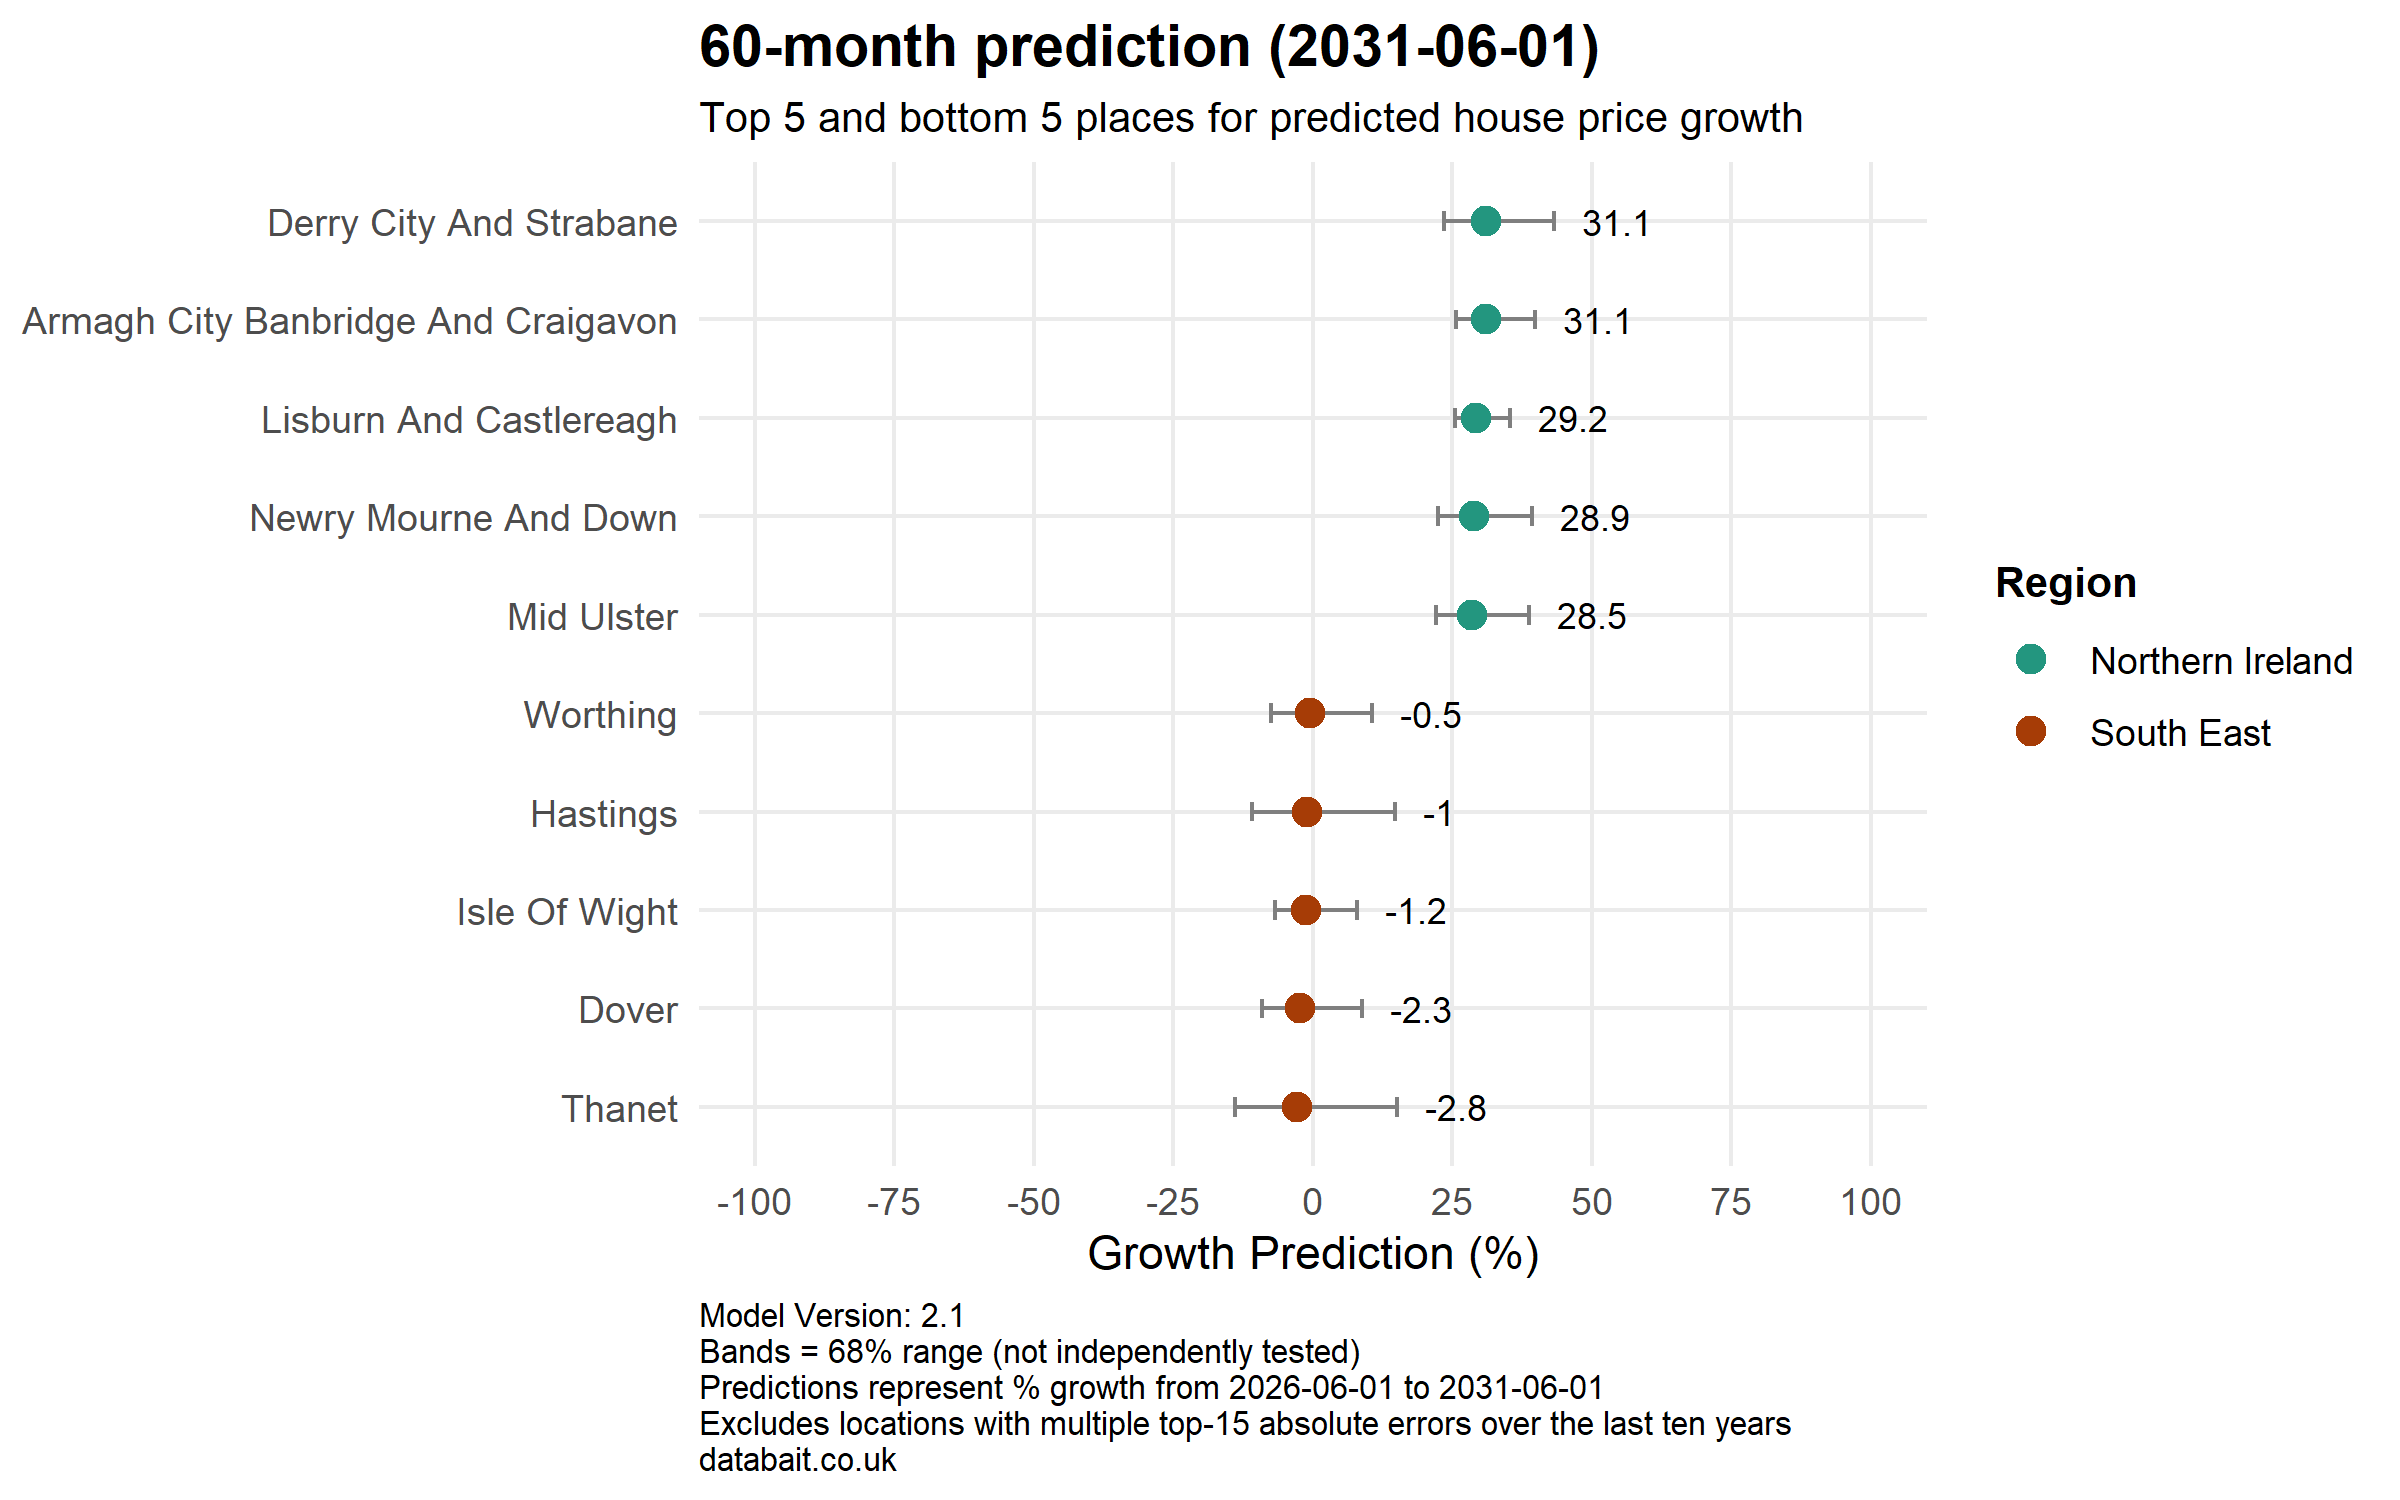
Over the full horizon Northern Ireland runs away with it: Derry City and Strabane and Armagh City, Banbridge and Craigavon are tied at +31.1%, with Lisburn and Castlereagh (+29.2%), Newry, Mourne and Down (+28.9%) and Mid Ulster (+28.5%) close behind. The bottom five has changed character entirely — London has dropped out and the South East coast has taken its place, with Thanet (−2.8%), Dover (−2.3%), the Isle of Wight (−1.2%), Hastings (−1.0%) and Worthing (−0.5%) all marginally negative over five years. The magnitudes matter here: the worst five-year outcome in the country is a 2.8% fall, so this is a story of stagnation on the Kent and Sussex coast rather than a crash anywhere.
Conclusion
Version 2.1 has torn up last month’s script. The rebalancing story used to run in two directions — the affordable North leading now, the South East and London leading later — but the new model keeps pointing the same way throughout. Northern Ireland leads on current growth, on the one-year forecast, on the five-year forecast and at every point in between, finishing at +29% while no other region clears +13%. London’s correction is expected to run another year before flattening, and the South East, not the capital, is now the model’s structural laggard, with a handful of Kent and Sussex coastal towns marginally negative over five years. The national path is unchanged at £297k by 2031, around 9.1% over five years. Still no boom, still no crash — just a different map.

Leave a comment